
PUBLISHER: Global Market Insights Inc. | PRODUCT CODE: 1928909

PUBLISHER: Global Market Insights Inc. | PRODUCT CODE: 1928909
Bio Vanillin Market Opportunity, Growth Drivers, Industry Trend Analysis, and Forecast 2026 - 2035
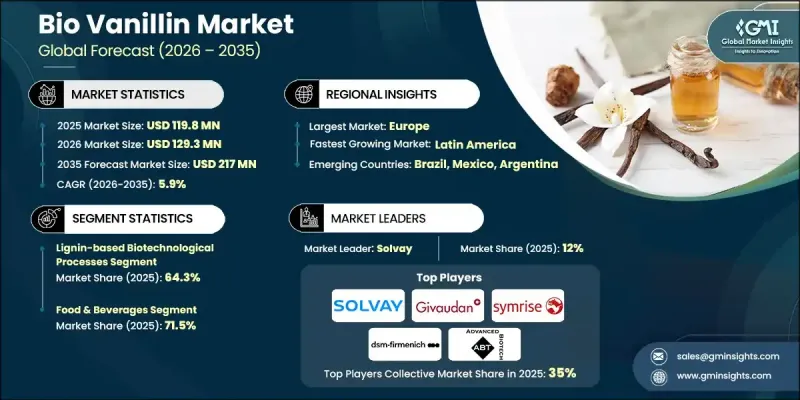
The Global Bio Vanillin Market was valued at USD 119.8 million in 2025 and is estimated to grow at a CAGR of 5.9% to reach USD 217 million by 2035.
Bio vanillin is gaining traction due to its production from sustainable, natural sources, making it a preferred eco-friendly alternative to synthetic vanillin. With advanced biotechnological processes, bio vanillin aligns with global sustainability initiatives focused on reducing environmental footprints. Rising consumer demand for natural and clean-label products across food, beverages, and personal care is boosting adoption. Industries increasingly prioritize green chemistry and reduced reliance on petrochemical-based ingredients. Bio vanillin's versatility allows its use as a premium flavoring agent in high-quality, organic food products, while also contributing to natural fragrance formulations. The growing global emphasis on sustainability, authentic taste profiles, and environmentally conscious practices continues to drive its adoption across multiple sectors, positioning bio vanillin as a key ingredient in modern, eco-focused product portfolios.
| Market Scope | |
|---|---|
| Start Year | 2025 |
| Forecast Year | 2026-2035 |
| Start Value | $119.8 Million |
| Forecast Value | $217 Million |
| CAGR | 5.9% |
The lignin-based biotechnological processes segment held 64.3% share and is expected to grow at a CAGR of 5.5% through 2035. These processes utilize renewable lignocellulosic materials and support circular economy principles. Ferulic acid conversion through microbial fermentation remains the primary pathway due to its efficiency and ability to produce high-purity vanillin. Alternative feedstocks such as eugenol and isoeugenol, naturally derived, also offer manufacturers flexibility in production and sustainability.
The food & beverages held 71.5% share in 2025 and is anticipated to grow at a CAGR of 5.7% between 2026 and 2035. Bio vanillin is used as a premium flavoring ingredient in clean-label and natural formulations, meeting consumer expectations for authentic taste and environmentally friendly sourcing. Its aromatic qualities also make it a preferred component in fragrance and perfumery applications, supporting green chemistry initiatives.
North America Bio Vanillin Market accounted for 27.5% share in 2025. The region's expansion is driven by strong manufacturing capabilities, sustainable production frameworks, and growing consumer demand for clean-label and natural products. The United States leads the region due to supportive renewable raw material policies and the adoption of environmentally conscious product formulations.
Key players in the Global Bio Vanillin Market include Symrise AG, Solvay, Givaudan, DSM Firmenich, Evolva, Advanced Biotech, Ennolys, Comax Flavors, IFF (International Flavors & Fragrances), Borregaard, Omega Ingredients Ltd, Beijing LYS Chemicals Co., Ltd, Alfrebro, LLC, Lesaffre, and Aurochemicals. Companies in the Global Bio Vanillin Market are enhancing their position by focusing on sustainable production, innovation, and strategic partnerships. Manufacturers are investing in advanced microbial fermentation and lignin-based technologies to improve yield, purity, and eco-efficiency. Expanding global distribution networks and forming collaborations with food, beverage, and personal care brands ensures wider market reach. Firms are also emphasizing R&D to develop alternative feedstocks, maintain cost competitiveness, and meet rising consumer demand for natural and clean-label products. Marketing strategies highlight sustainability, premium quality, and regulatory compliance to strengthen brand recognition and market penetration.
Table of Contents
Chapter 1 Methodology & Scope
- 1.1 Market scope and definition
- 1.2 Research design
- 1.2.1 Research approach
- 1.2.2 Data collection methods
- 1.3 Data mining sources
- 1.3.1 Global
- 1.3.2 Regional/Country
- 1.4 Base estimates and calculations
- 1.4.1 Base year calculation
- 1.4.2 Key trends for market estimation
- 1.5 Primary research and validation
- 1.5.1 Primary sources
- 1.6 Forecast model
- 1.7 Research assumptions and limitations
Chapter 2 Executive Summary
- 2.1 Industry 360° synopsis
- 2.2 Key market trends
- 2.2.1 Regional
- 2.2.2 Production technology
- 2.2.3 Application
- 2.3 TAM Analysis, 2026-2035
- 2.4 CXO perspectives: Strategic imperatives
- 2.4.1 Executive decision points
- 2.4.2 Critical success factors
- 2.5 Future Outlook and Strategic Recommendations
Chapter 3 Industry Insights
- 3.1 Industry ecosystem analysis
- 3.1.1 Supplier landscape
- 3.1.2 Profit margin
- 3.1.3 Value addition at each stage
- 3.1.4 Factor affecting the value chain
- 3.1.5 Disruptions
- 3.2 Industry impact forces
- 3.2.1 Growth drivers
- 3.2.1.1 Rising consumer demand for natural & clean-label ingredients
- 3.2.1.2 Regulatory pressure on synthetic vanillin
- 3.2.1.3 Sustainability commitments by F&B giants
- 3.2.2 Industry pitfalls and challenges
- 3.2.2.1 Vanillin toxicity to microbial hosts
- 3.2.2.2 High production costs vs synthetic vanillin
- 3.2.3 Market opportunities
- 3.2.3.1 Geographic expansion in emerging markets
- 3.2.3.2 Novel substrate utilization (waste biomass)
- 3.2.1 Growth drivers
- 3.3 Growth potential analysis
- 3.4 Regulatory landscape
- 3.4.1 North America
- 3.4.2 Europe
- 3.4.3 Asia Pacific
- 3.4.4 Latin America
- 3.4.5 Middle East & Africa
- 3.5 Porter';s analysis
- 3.6 PESTEL analysis
- 3.7 Price trends
- 3.7.1 By region
- 3.7.2 By production technology
- 3.8 Future market trends
- 3.9 Technology and Innovation landscape
- 3.9.1 Current technological trends
- 3.9.2 Emerging technologies
- 3.10 Patent Landscape
- 3.11 Trade statistics (HS code)
( Note: the trade statistics will be provided for key countries only)
- 3.11.1 Major importing countries
- 3.11.2 Major exporting countries
- 3.12 Sustainability and environmental aspects
- 3.12.1 Sustainable practices
- 3.12.2 Waste reduction strategies
- 3.12.3 Energy efficiency in production
- 3.12.4 Eco-friendly initiatives
- 3.13 Carbon footprint consideration
Chapter 4 Competitive Landscape, 2025
- 4.1 Introduction
- 4.2 Company market share analysis
- 4.2.1 By region
- 4.2.1.1 North America
- 4.2.1.2 Europe
- 4.2.1.3 Asia Pacific
- 4.2.1.4 LATAM
- 4.2.1.5 MEA
- 4.2.1 By region
- 4.3 Company matrix analysis
- 4.4 Competitive analysis of major market players
- 4.5 Competitive positioning matrix
- 4.6 Key developments
- 4.6.1 Mergers & acquisitions
- 4.6.2 Partnerships & collaborations
- 4.6.3 New Product Launches
- 4.6.4 Expansion Plans
Chapter 5 Market Estimates and Forecast, By Production Technology, 2022-2035 (USD Million) (Kilo Tons)
- 5.1 Key trends
- 5.2 Lignin-based biotechnological processes
- 5.3 Ferulic acid bioconversion
- 5.4 Eugenol bioconversion
- 5.5 Isoeugenol bioconversion
- 5.6 Other production technologies
- 5.6.1 Caffeic acid bioconversion
- 5.6.2 Glucose fermentation
- 5.6.3 Veratraldehyde biotransformation
Chapter 6 Market Estimates and Forecast, By Application, 2022-2035 (USD Million) (Kilo Tons)
- 6.1 Key trends
- 6.2 Food & beverages
- 6.2.1 Ice cream & frozen desserts
- 6.2.2 Chocolate & cocoa products
- 6.2.3 Confectioneries & baked goods
- 6.2.4 Beverages
- 6.2.5 Dairy products (yogurt, flavored milk)
- 6.2.6 Others (cereals, snacks, sauces)
- 6.3 Fragrances & perfumery
- 6.3.1 Fine fragrances
- 6.3.2 Personal care products
- 6.3.3 Household products
- 6.4 Pharmaceuticals
- 6.4.1 Oral medications
- 6.4.2 Topical formulations
- 6.4.3 Nutraceuticals & dietary supplements
- 6.5 Cosmetics & personal care
- 6.5.1 Skincare products
- 6.5.2 Haircare products
- 6.5.3 Color cosmetics
- 6.6 Others
- 6.6.1 Industrial applications
- 6.6.2 Animal feed additives
Chapter 7 Market Estimates and Forecast, By Region, 2022-2035 (USD Million) (Kilo Tons)
- 7.1 Key trends
- 7.2 North America
- 7.2.1 U.S.
- 7.2.2 Canada
- 7.3 Europe
- 7.3.1 Germany
- 7.3.2 UK
- 7.3.3 France
- 7.3.4 Spain
- 7.3.5 Italy
- 7.3.6 Rest of Europe
- 7.4 Asia Pacific
- 7.4.1 China
- 7.4.2 India
- 7.4.3 Japan
- 7.4.4 Australia
- 7.4.5 South Korea
- 7.4.6 Rest of Asia Pacific
- 7.5 Latin America
- 7.5.1 Brazil
- 7.5.2 Mexico
- 7.5.3 Argentina
- 7.5.4 Rest of Latin America
- 7.6 Middle East and Africa
- 7.6.1 Saudi Arabia
- 7.6.2 South Africa
- 7.6.3 UAE
- 7.6.4 Rest of Middle East and Africa
Chapter 8 Company Profiles
- 8.1 Solvay
- 8.2 Givaudan
- 8.3 Symrise AG
- 8.4 DSM Firmenich
- 8.5 Advanced Biotech
- 8.6 Evolva
- 8.7 Ennolys
- 8.8 Comax Flavors
- 8.9 Omega Ingredients Ltd
- 8.10 Beijing LYS Chemicals Co., Ltd
- 8.11 Aurochemicals
- 8.12 Borregaard
- 8.13 Alfrebro, LLC
- 8.14 IFF (International Flavors & Fragrances)
- 8.15 Lesaffre

