
PUBLISHER: Global Market Insights Inc. | PRODUCT CODE: 1666662

PUBLISHER: Global Market Insights Inc. | PRODUCT CODE: 1666662
Hydrogen Storage Tanks and Transportation Market Opportunity, Growth Drivers, Industry Trend Analysis, and Forecast 2025 - 2034
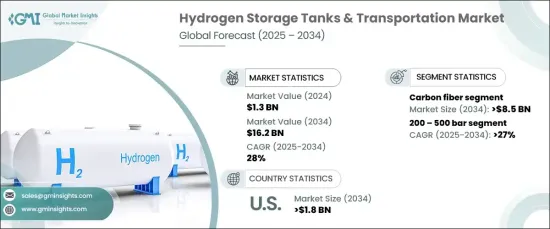
The Global Hydrogen Storage Tanks And Transportation Market, valued at USD 1.3 billion in 2024, is poised for rapid growth with a projected CAGR of 28% from 2025 to 2034. The increasing adoption of hydrogen-powered technologies is a key factor driving this growth. However, the high-pressure requirements for storing hydrogen as a compressed gas add to the refueling infrastructure costs. Despite these challenges, global investments are actively enhancing the affordability and efficiency of hydrogen storage systems, propelling market expansion.
Hydrogen storage tanks and transportation systems are critical for securely storing and moving hydrogen, a highly volatile and flammable substance. These systems are designed to accommodate hydrogen in various forms, including compressed liquid, gas, or solid, depending on specific applications. Governments around the world are implementing supportive policies and providing funding to develop advanced storage and transportation solutions. These efforts aim to facilitate the adoption of hydrogen-powered applications and integrate renewable energy more effectively.
| Market Scope | |
|---|---|
| Start Year | 2024 |
| Forecast Year | 2025-2034 |
| Start Value | $1.3 Billion |
| Forecast Value | $16.2 Billion |
| CAGR | 28% |
The market for carbon fiber in hydrogen storage is expected to surpass USD 8.5 billion by 2034. Known for its outstanding corrosion resistance and superior strength-to-weight ratio, carbon fiber is an ideal material for high-pressure hydrogen storage. It allows for compact storage solutions while reducing overall system weight, improving efficiency in modern storage applications.
Hydrogen storage systems with a pressure range of 200-500 bar are anticipated to grow at a rate exceeding 27% through 2034. The aerospace sector, supported by government investments in both established and emerging markets, is a major driver of this segment's growth. Additionally, the increasing use of hydrogen technology in fuel cell applications and high-pressure industrial operations is contributing to the rising demand for these storage solutions.
In the United States, the hydrogen storage and transportation market is projected to exceed USD 1.8 billion by 2034. Federal support and technological advancements are accelerating the adoption of hydrogen in various sectors. Developments in infrastructure and high-pressure storage solutions are fostering industry growth, aligned with efforts to reduce carbon emissions and build a sustainable energy framework.
The Asia Pacific region is also experiencing significant market growth, driven by increasing hydrogen demand in industrial sectors such as refining, energy storage, and metal processing. Investments in refueling infrastructure and advancements in hydrogen storage technologies are further supporting the region's transition to clean energy, shaping a promising market outlook.
Table of Contents
Chapter 1 Methodology & Scope
- 1.1 Market scope & definitions
- 1.2 Market estimates & forecast parameters
- 1.3 Forecast calculation
- 1.4 Data sources
- 1.4.1 Primary
- 1.4.2 Secondary
- 1.4.2.1 Paid
- 1.4.2.2 Public
Chapter 2 Executive Summary
- 2.1 Industry synopsis, 2021 - 2034
Chapter 3 Industry Insights
- 3.1 Industry ecosystem analysis
- 3.2 Regulatory landscape
- 3.3 Industry impact forces
- 3.3.1 Growth drivers
- 3.3.2 Industry pitfalls & challenges
- 3.4 Growth potential analysis
- 3.5 Porter's Analysis
- 3.5.1 Bargaining power of suppliers
- 3.5.2 Bargaining power of buyers
- 3.5.3 Threat of new entrants
- 3.5.4 Threat of substitutes
- 3.6 PESTEL Analysis
Chapter 4 Competitive Landscape, 2024
- 4.1 Introduction
- 4.2 Strategic outlook
- 4.3 Innovation & sustainability landscape
Chapter 5 Market Size and Forecast, By Material, 2021 – 2034 (USD Million)
- 5.1 Key trends
- 5.2 Metals
- 5.3 Glass fibers
- 5.4 Carbon fibers
Chapter 6 Market Size and Forecast, By Tank Type, 2021 – 2034 (USD Million)
- 6.1 Key trends
- 6.2 Type 1
- 6.3 Type 2
- 6.4 Type 3
- 6.5 Type 4
Chapter 7 Market Size and Forecast, By Pressure, 2021 – 2034 (USD Million)
- 7.1 Key trends
- 7.2 Industrial
- 7.3 Below 200 bar
- 7.4 200 - 500 bar
- 7.5 Above 500 bar
Chapter 8 Market Size and Forecast, By Application, 2021 – 2034 (USD Million)
- 8.1 Key trends
- 8.2 Vehicles
- 8.3 Railways
- 8.4 Marine
Chapter 9 Market Size and Forecast, By Region, 2021 – 2034 (USD Million)
- 9.1 Key trends
- 9.2 North America
- 9.2.1 U.S.
- 9.2.2 Canada
- 9.2.3 Mexico
- 9.3 Europe
- 9.3.1 Germany
- 9.3.2 UK
- 9.3.3 France
- 9.3.4 Italy
- 9.3.5 Netherlands
- 9.3.6 Russia
- 9.4 Asia Pacific
- 9.4.1 China
- 9.4.2 India
- 9.4.3 Japan
- 9.4.4 South Korea
- 9.5 Rest of World
Chapter 10 Company Profiles
- 10.1 BayoTech
- 10.2 Composite Advanced Technologies, LLC
- 10.3 Doosan Mobility Innovation
- 10.4 ECS GmbH & Co. KG
- 10.5 HENSOLDT
- 10.6 Hexagon Purus
- 10.7 Luxfer Gas Cylinders
- 10.8 Mahytec
- 10.9 Marine Service Noord
- 10.10 NPROXX
- 10.11 Plastic Omnium
- 10.12 Pragma Industries
- 10.13 Quantum Fuel Systems LLC
- 10.14 Steelhead Composites, Inc.
- 10.15 Tenaris
- 10.16 Umoe Advanced Composites
- 10.17 Weldship Corporation
- 10.18 Worthington Industries Inc.

