
PUBLISHER: Global Market Insights Inc. | PRODUCT CODE: 1871279

PUBLISHER: Global Market Insights Inc. | PRODUCT CODE: 1871279
Testing, Inspection and Certification (TIC) Services Market Opportunity, Growth Drivers, Industry Trend Analysis, and Forecast 2025 - 2034
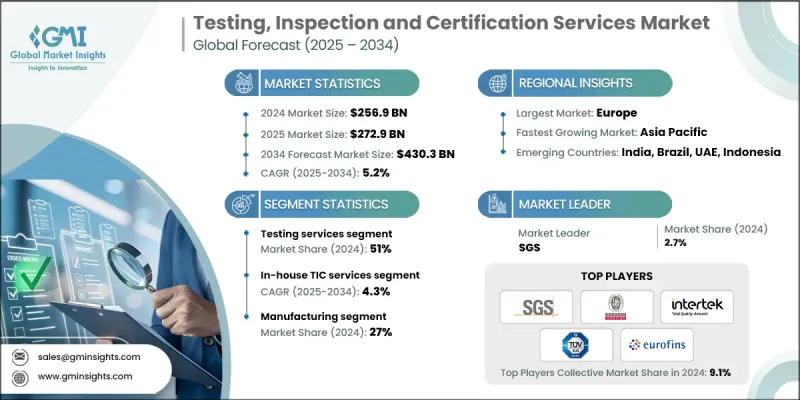
The Global Testing, Inspection, and Certification (TIC) Services Market was valued at USD 256.9 billion in 2024 and is estimated to grow at a CAGR of 5.2% to reach USD 430.3 billion by 2034.
The TIC services market plays a vital role in ensuring product quality, safety, and compliance across diverse industries, including manufacturing, energy, construction, and consumer goods. These services help manufacturers verify that their products meet both domestic and international standards, guaranteeing consistency, safety, and reliability before entering global markets. As global trade expands, TIC services are becoming essential in minimizing risk, maintaining consumer trust, and enhancing operational efficiency. The increasing importance of regulatory compliance, particularly in sectors such as automotive, healthcare, food, and electronics, continues to drive steady demand for TIC services. Governments and private entities worldwide depend on these services to ensure that products meet stringent quality, performance, and environmental regulations. The rising complexity of international trade and heightened safety expectations are pushing companies to rely more on independent TIC providers, further strengthening market growth globally.
| Market Scope | |
|---|---|
| Start Year | 2024 |
| Forecast Year | 2025-2034 |
| Start Value | $256.9 Billion |
| Forecast Value | $430.3 Billion |
| CAGR | 5.2% |
Government mandates across regions like North America, Europe, and Asia-Pacific are accelerating demand for third-party TIC services. National and regional authorities require consistent product testing and certification to protect consumer health and ensure environmental safety, both domestically and for exports. Manufacturers increasingly partner with accredited TIC service providers to handle compliance assessments, enabling them to meet international trade standards efficiently. Independent testing and certification validate that products adhere to import regulations and regional technical requirements, helping companies gain faster market access and reduce the risk of costly recalls or export rejections.
The testing services segment held a 51% share in 2024. These services are widely applied across healthcare, manufacturing, electronics, and consumer goods sectors to ensure performance accuracy and safety. Testing remains an essential step in confirming compliance with both local and international standards. Inspection services, on the other hand, are widely adopted in industries such as construction and agriculture to verify product safety, quality consistency, and compliance with regulatory norms before market release.
The in-house TIC services segment is projected to grow at a CAGR of 4.3% from 2025 to 2034. Many companies prefer to perform TIC operations internally to maintain direct oversight and safeguard proprietary information. In-house services also provide faster turnaround times, greater control over quality assurance, and alignment with internal compliance frameworks. Organizations investing in this approach often allocate capital to establish testing laboratories, specialized equipment, and technical expertise, ensuring efficient and confidential service delivery while maintaining adherence to global standards.
U.S. Testing, Inspection, and Certification (TIC) Services Market generated USD 63.7 billion in 2024. The country's market growth is primarily driven by the manufacturing sector, which depends heavily on TIC services for maintaining production standards, regulatory compliance, and product reliability. The industry's role in supporting critical sectors such as automotive, electronics, and machinery underscores its importance in maintaining product integrity and sustaining competitiveness in international markets.
Key companies operating in the Global Testing, Inspection and Certification (TIC) Services Market include TUV SUD, SGS, DEKRA, Eurofins, Bureau Veritas, BSI, DNV, TUV Rheinland, Intertek, and UL Solutions. Companies operating in the Testing, Inspection, and Certification (TIC) Services Market are strengthening their global presence through mergers, acquisitions, and strategic alliances to expand their service portfolios and geographical reach. Leading firms are heavily investing in automation, digital platforms, and AI-based inspection tools to improve testing accuracy, reduce turnaround time, and enhance efficiency. Many are adopting sustainability-driven testing and compliance solutions in response to growing environmental regulations. Expanding capabilities in emerging sectors such as renewable energy, autonomous vehicles, and smart manufacturing has also become a key focus.
Table of Contents
Chapter 1 Methodology
- 1.1 Market scope and definition
- 1.2 Research design
- 1.2.1 Research approach
- 1.2.2 Data collection methods
- 1.3 Data mining sources
- 1.3.1 Global
- 1.3.2 Regional/Country
- 1.4 Base estimates and calculations
- 1.4.1 Base year calculation
- 1.4.2 Key trends for market estimation
- 1.5 Primary research and validation
- 1.5.1 Primary sources
- 1.6 Forecast
- 1.7 Research assumptions and limitations
Chapter 2 Executive Summary
- 2.1 Industry 3600 synopsis, 2021 - 2034
- 2.2 Key market trends
- 2.2.1 Regional
- 2.2.2 Service
- 2.2.3 Sourcing
- 2.2.4 End Use
- 2.3 TAM Analysis, 2025-2034
- 2.4 CXO perspectives: Strategic imperatives
- 2.4.1 Executive decision points
- 2.4.2 Critical success factors
- 2.5 Future outlook and strategic recommendations
Chapter 3 Industry Insights
- 3.1 Industry ecosystem analysis
- 3.1.1 Supplier landscape
- 3.1.2 Profit margin analysis
- 3.1.3 Cost structure
- 3.1.4 Value addition at each stage
- 3.1.5 Factor affecting the value chain
- 3.1.6 Disruptions
- 3.2 Industry impact forces
- 3.2.1 Growth drivers
- 3.2.1.1 Growing enforcement of stringent product safety and quality regulations
- 3.2.1.2 Rising industrialization and manufacturing output in emerging economies
- 3.2.1.3 Increased consumer awareness and demand for certified, sustainable products
- 3.2.1.4 Adoption of digital and remote inspection technologies (AI, IoT, blockchain)
- 3.2.2 Industry pitfalls and challenges
- 3.2.2.1 High operational and service costs for complex testing environments
- 3.2.2.2 Variability in certification standards across regions
- 3.2.3 Market opportunities
- 3.2.3.1 Expansion of TIC services in renewable energy, EVs, and green technologies
- 3.2.3.2 Growing demand for cybersecurity and digital system certification
- 3.2.1 Growth drivers
- 3.3 Growth potential analysis
- 3.4 Regulatory landscape
- 3.4.1 North America
- 3.4.2 Europe
- 3.4.3 Asia Pacific
- 3.4.4 Latin America
- 3.4.5 Middle East & Africa
- 3.5 Porter's analysis
- 3.6 PESTEL analysis
- 3.7 Technology and innovation landscape
- 3.7.1 Current technological trends
- 3.7.2 Emerging technologies
- 3.8 Patent analysis
- 3.9 Sustainability & environmental aspects
- 3.9.1 Carbon Footprint Assessment
- 3.9.2 Circular Economy Integration
- 3.9.3 E-Waste Management Requirements
- 3.9.4 Green Manufacturing Initiatives
- 3.10 Use cases and applications
- 3.11 Best-case scenario
- 3.12 Cost-Benefit Analysis Framework
- 3.12.1 In-House vs Outsourced TIC services cost comparison
- 3.12.2 Total Cost of Ownership (TCO) analysis
- 3.12.3 Time-to-market impact assessment
- 3.12.4 Compliance risk mitigation value analysis
- 3.12.5 Digital vs traditional service delivery cost models
- 3.13 Market maturity & technology adoption analysis
- 3.13.1 TIC market maturity assessment by region
- 3.13.2 technology adoption curves & implementation timelines
- 3.13.3 digital transformation readiness index
- 3.13.4 regulatory harmonization progress analysis
- 3.13.5 industry benchmarking studies
- 3.14 Client Requirements & Procurement Analysis
- 3.14.1 Vendor selection criteria & benchmarking framework
- 3.14.2 Compliance cost optimization strategies
- 3.14.3 ROI analysis & performance metrics
- 3.14.4 Risk management & business continuity requirements
- 3.14.5 Digital capability assessment framework
- 3.14.6 Quality assurance & accreditation requirement
Chapter 4 Competitive Landscape, 2024
- 4.1 Introduction
- 4.2 Company market share analysis
- 4.2.1 North America
- 4.2.2 Europe
- 4.2.3 Asia Pacific
- 4.2.4 LATAM
- 4.2.5 MEA
- 4.3 Competitive analysis of major market players
- 4.4 Competitive positioning matrix
- 4.5 Strategic outlook matrix
- 4.6 Key developments
- 4.6.1 Mergers & acquisitions
- 4.6.2 Partnerships & collaborations
- 4.6.3 New product launches
- 4.6.4 Expansion plans and funding
Chapter 5 Market Estimates & Forecast, By Service, 2021 - 2034 ($Mn)
- 5.1 Key trends
- 5.2 Testing Services
- 5.2.1 Electromagnetic compatibility testing
- 5.2.2 Electrical safety and performance testing
- 5.2.3 Mechanical and materials testing
- 5.2.4 Others
- 5.3 Inspection Services
- 5.3.1 Pre-shipment and consignment inspection
- 5.3.2 Industrial site and equipment inspection
- 5.3.3 Construction and infrastructure inspection
- 5.3.4 Others
- 5.4 Certification Services
- 5.4.1 Product certification
- 5.4.2 Management system certification
- 5.4.3 Personnel certification
- 5.4.4 Others
- 5.5 Calibration Services
- 5.5.1 Instrument calibration
- 5.5.2 Metrology and measurement standards
- 5.5.3 Others
- 5.6 Others
Chapter 6 Market Estimates & Forecast, By Sourcing, 2021 - 2034 ($Mn)
- 6.1 Key trends
- 6.2 In-House TIC Services
- 6.2.1 Internal testing and quality control laboratories
- 6.2.2 Captive inspection and certification departments
- 6.2.3 Corporate R&D and compliance testing centers
- 6.2.4 Others
- 6.3 Outsourced TIC Services
- 6.3.1 Independent third-party TIC providers
- 6.3.2 Contract-based testing laboratories
- 6.3.3 External inspection and certification bodies
- 6.3.4 Others
Chapter 7 Market Estimates & Forecast, By End Use, 2021 - 2034 ($Mn)
- 7.1 Key trends
- 7.2 Manufacturing
- 7.2.1 Industrial machinery and equipment testing
- 7.2.2 Quality control and factory audits
- 7.2.3 Supply chain and component verification
- 7.3 Energy and Utilities
- 7.3.1 Renewable energy system testing
- 7.3.2 Smart grid and battery certification
- 7.3.3 Nuclear plant safety inspection
- 7.3.4 Oil and gas asset integrity assessments
- 7.4 Food and Beverages
- 7.4.1 Food safety and hygiene testing
- 7.4.2 Packaging and labeling compliance
- 7.4.3 Supply chain traceability and origin verification
- 7.4.4 Organic and sustainability certifications
- 7.5 Automotive
- 7.5.1 Electric vehicle testing and certification
- 7.5.2 Autonomous vehicle validation
- 7.5.3 Connected car cybersecurity testing
- 7.5.4 Vehicle inspection and homologation
- 7.6 Chemicals
- 7.6.1 Chemical composition and purity testing
- 7.6.2 Hazardous material certification
- 7.6.3 Environmental and regulatory compliance audits
- 7.7 Construction and Infrastructure
- 7.7.1 Building materials testing
- 7.7.2 Structural integrity inspections
- 7.7.3 Green building and sustainability certification
- 7.8 Healthcare and Life Sciences
- 7.8.1 Biocompatibility and sterilization testing
- 7.8.2 Pharmaceutical and clinical trial validation
- 7.8.3 Medical device and software validation
- 7.9 Aerospace and Defense
- 7.9.1 Aviation component certification
- 7.9.2 Defense system and military standards testing
- 7.9.3 Space system qualification
- 7.10 Consumer Products
- 7.10.1 Electrical appliance safety testing
- 7.10.2 Toy, textile, and cosmetic certification
- 7.10.3 Consumer protection and quality assurance
- 7.11 Others
Chapter 8 Market Estimates & Forecast, By Region, 2021 - 2034 ($Mn)
- 8.1 Key trends
- 8.2 North America
- 8.2.1 US
- 8.2.2 Canada
- 8.3 Europe
- 8.3.1 Germany
- 8.3.2 UK
- 8.3.3 France
- 8.3.4 Italy
- 8.3.5 Spain
- 8.3.6 Nordics
- 8.3.7 Russia
- 8.4 Asia Pacific
- 8.4.1 China
- 8.4.2 India
- 8.4.3 Japan
- 8.4.4 Australia
- 8.4.5 South Korea
- 8.4.6 Southeast Asia
- 8.5 Latin America
- 8.5.1 Brazil
- 8.5.2 Mexico
- 8.5.3 Argentina
- 8.6 MEA
- 8.6.1 South Africa
- 8.6.2 Saudi Arabia
- 8.6.3 UAE
Chapter 9 Company Profiles
- 9.1 Top Global Players
- 9.1.1 Bureau Veritas
- 9.1.2 DEKRA
- 9.1.3 DNV
- 9.1.4 Eurofins Scientific
- 9.1.5 Intertek
- 9.1.6 SGS
- 9.1.7 TUV Rheinland
- 9.1.8 TUV SUD
- 9.2 Regional Champions
- 9.2.1 APAVE
- 9.2.2 BSI
- 9.2.3 Centre Testing International
- 9.2.4 CCIC
- 9.2.5 CSA
- 9.2.6 Lloyd's Register
- 9.2.7 SOCOTEC
- 9.2.8 UL Solutions
- 9.3 Emerging Players & Specialists
- 9.3.1 ALS
- 9.3.2 Applus+ Services
- 9.3.3 Element Materials Technology
- 9.3.4 Kiwa
- 9.3.5 NSF International
- 9.3.6 QIMA
- 9.3.7 RINA

