
PUBLISHER: Global Market Insights Inc. | PRODUCT CODE: 1666624

PUBLISHER: Global Market Insights Inc. | PRODUCT CODE: 1666624
Hydrogen Storage Tanks Market Opportunity, Growth Drivers, Industry Trend Analysis, and Forecast 2025 - 2034
The Global Hydrogen Storage Tanks Market reached USD 294.5 million in 2024 and is projected to expand at an impressive CAGR of 41.2% from 2025 to 2034. This remarkable growth is fueled by the increasing adoption of hydrogen in both the transportation and industrial sectors, where advanced storage solutions like high-pressure and cryogenic tanks are becoming essential. As industries move toward more sustainable energy sources, hydrogen is gaining traction as a clean fuel alternative. The need for reliable, efficient, and scalable storage systems is rising, particularly as the hydrogen economy begins to gain more momentum. Lightweight composite materials are playing a pivotal role in improving tank efficiency, enhancing safety, and reducing costs, thus fostering a quicker transition to hydrogen as an energy carrier. Moreover, significant government investments in hydrogen infrastructure, including refueling networks and storage methods, are accelerating the market expansion.
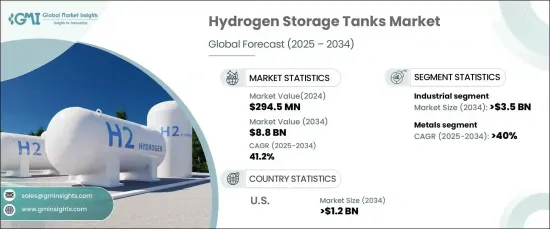
The industrial sector, in particular, is projected to generate USD 3.5 billion by 2034, driven by the growing reliance on hydrogen in crucial applications such as refining, metal processing, and glass manufacturing. The shift towards renewable energy and the strategic necessity for hydrogen storage solutions in energy-import-dependent regions are contributing to the market's increasing demand. As industries focus on cost-effective and sustainable alternatives, hydrogen storage tanks have become indispensable for meeting growing energy needs.
| Market Scope | |
|---|---|
| Start Year | 2024 |
| Forecast Year | 2025-2034 |
| Start Value | $294.5 Million |
| Forecast Value | $8.8 Billion |
| CAGR | 41.2% |
Looking at the product segment, the metal-based hydrogen storage tanks are anticipated to grow at a CAGR of 40% by 2034. This growth is primarily driven by the material's exceptional strength and durability. The combination of carbon fibers with polymer resins forms a robust composite material capable of withstanding extreme pressures while ensuring structural integrity, making metal-based tanks highly reliable for hydrogen storage.
In the United States, the hydrogen storage tank market is forecast to generate USD 1.2 billion by 2034. This surge is backed by substantial investments in clean energy initiatives, as well as technological advancements in hydrogen infrastructure. The demand for high-pressure storage systems is growing, especially as hydrogen-powered vehicles and renewable energy systems gain prominence. The U.S. is also making strides in the development of lightweight, high-pressure storage solutions that enhance hydrogen's practicality as an energy source.
Table of Contents
Chapter 1 Methodology & Scope
- 1.1 Market scope & definitions
- 1.2 Market estimates & forecast parameters
- 1.3 Forecast calculation
- 1.4 Data sources
- 1.4.1 Primary
- 1.4.2 Secondary
- 1.4.2.1 Paid
- 1.4.2.2 Public
Chapter 2 Executive Summary
- 2.1 Industry synopsis, 2021 - 2034
Chapter 3 Industry Insights
- 3.1 Industry ecosystem analysis
- 3.2 Regulatory landscape
- 3.3 Industry impact forces
- 3.3.1 Growth drivers
- 3.3.2 Industry pitfalls & challenges
- 3.4 Growth potential analysis
- 3.5 Porter's analysis
- 3.5.1 Bargaining power of suppliers
- 3.5.2 Bargaining power of buyers
- 3.5.3 Threat of new entrants
- 3.5.4 Threat of substitutes
- 3.6 PESTEL analysis
Chapter 4 Competitive Landscape, 2024
- 4.1 Introduction
- 4.2 Strategic outlook
- 4.3 Innovation & sustainability landscape
Chapter 5 Market Size and Forecast, By Material, 2021 – 2034 (USD Million)
- 5.1 Key trends
- 5.2 Metals
- 5.3 Glass fibers
- 5.4 Carbon fibers
Chapter 6 Market Size and Forecast, By Tank Type, 2021 – 2034 (USD Million)
- 6.1 Key trends
- 6.2 Type 1
- 6.3 Type 2
- 6.4 Type 3
- 6.5 Type 4
Chapter 7 Market Size and Forecast, By Pressure, 2021 – 2034 (USD Million)
- 7.1 Key trends
- 7.2 Below 200 bar
- 7.3 200 - 500 bar
- 7.4 Above 500 bar
Chapter 8 Market Size and Forecast, By Storage Form, 2021 – 2034 (USD Million)
- 8.1 Key trends
- 8.2 Physical based
- 8.3 Material based
Chapter 9 Market Size and Forecast, By Application, 2021 – 2034 (USD Million)
- 9.1 Key trends
- 9.2 Industrial
- 9.3 Transportation
- 9.4 Others
Chapter 10 Market Size and Forecast, By Region, 2021 – 2034 (USD Million)
- 10.1 Key trends
- 10.2 North America
- 10.2.1 U.S.
- 10.2.2 Canada
- 10.2.3 Mexico
- 10.3 Europe
- 10.3.1 Germany
- 10.3.2 UK
- 10.3.3 France
- 10.3.4 Italy
- 10.3.5 Netherlands
- 10.3.6 Russia
- 10.4 Asia Pacific
- 10.4.1 China
- 10.4.2 India
- 10.4.3 Japan
- 10.4.4 South Korea
- 10.5 Rest of World
Chapter 11 Company Profiles
- 11.1 BayoTech
- 11.2 Doosan Mobility Innovation
- 11.3 ECS
- 11.4 Hensoldt
- 11.5 Hexagon Purus
- 11.6 Luxfer Gas Cylinders
- 11.7 Mahytec
- 11.8 NPROXX
- 11.9 Plastic Omnium
- 11.10 Pragma Industries
- 11.11 Quantum Fuel Systems
- 11.12 Steelhead Composites
- 11.13 Umoe Advanced Composites
- 11.14 Weldship
- 11.15 Worthington Industries

