
PUBLISHER: Global Market Insights Inc. | PRODUCT CODE: 1797876

PUBLISHER: Global Market Insights Inc. | PRODUCT CODE: 1797876
Indonesia and Malaysia Lead Acid Battery Market Opportunity, Growth Drivers, Industry Trend Analysis, and Forecast 2025 - 2034
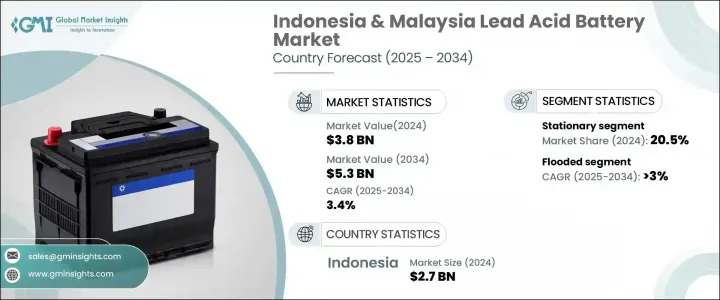
Indonesia And Malaysia Lead Acid Battery Market was valued at USD 3.8 billion in 2024 and are estimated to grow at a CAGR of 3.4% to reach USD 5.3 billion by 2034. Industry growth is supported by the rising need for uninterrupted power supply in sectors where operational downtime is costly. Expanding telecom infrastructure, including mobile base stations and internet facilities, continues to boost demand, as these systems rely heavily on dependable backup solutions during grid instability. The market is also benefiting from higher adoption in automotive applications, particularly for starting, lighting, and ignition (SLI) functions in vehicles powered by internal combustion engines. This sustained demand, coupled with the replacement-driven aftermarket, is creating steady revenue streams for industry players. In regions with challenging climates or infrastructure, frequent battery replacement cycles are further strengthening market penetration, fostering a robust supply and service network across both urban and remote locations.
Lead acid batteries, known for their reliability and cost-effectiveness, operate using lead plates and sulfuric acid as the core components for energy storage and release. Their design, which typically requires replacement every two to five years, depending on maintenance and usage conditions, supports a recurring demand pattern that benefits suppliers and service providers alike. The market's momentum is enhanced by growing investments in backup power systems for commercial, industrial, and critical service environments, where quick response and consistent energy delivery are essential. These factors, combined with their established use in renewable energy integration for localized storage, are positioning lead acid batteries as a resilient segment in the broader energy storage landscape.
| Market Scope | |
|---|---|
| Start Year | 2024 |
| Forecast Year | 2025-2034 |
| Start Value | $3.8 Billion |
| Forecast Value | $5.3 Billion |
| CAGR | 3.4% |
By application, the market is segmented into motive, stationary, and SLI categories. The stationary segment accounted for 20.5% of total revenue in 2024 and is projected to expand at a CAGR exceeding 3.5% through 2034. Demand in this segment is driven by the need for dependable backup power in facilities and infrastructure that require continuous operation. Their role in supporting short-duration backup during power interruptions is contributing to stable demand across multiple commercial and institutional settings. The adoption of advanced sealed designs, including valve-regulated types, is also increasing, particularly in scenarios where maintenance accessibility is limited.
In terms of construction, the industry is divided into flooded and valve-regulated lead acid (VRLA) batteries. The flooded battery segment held the dominant share of 81.3% in 2024 and is expected to maintain growth at a rate of over 3% through the forecast period. These batteries remain prevalent in cost-sensitive installations where durability and tolerance to operational stress are critical. The segment's expansion is further supported by design improvements aimed at reducing maintenance needs and enhancing performance longevity. Their ability to handle deep discharge cycles and perform reliably under variable load conditions ensures their continued relevance in diverse energy storage applications.
Regionally, Indonesia accounted for the largest share of the combined market, representing approximately 71.3% in 2024, with revenues reaching USD 2.7 billion. The country's dominance is attributed to its high demand from multiple sectors, coupled with ongoing infrastructure expansion that requires reliable energy storage. Both rural and urban markets are contributing to this growth, with increasing deployments of off-grid and distributed power systems helping bridge electrification gaps. The expansion of network infrastructure into less accessible areas is also boosting the use of batteries for essential backup requirements.
Prominent companies in the Indonesia and Malaysia lead acid battery market include ABM Fujiya, Amara Raja Energy & Mobility, C&D Technologies, Century Batteries Indonesia, Century Yuasa Batteries, Clarios, EnerSys, Exide Industries, GP Marketing, GS Yuasa International, Hoppecke, JYC Battery Manufacturer, Leoch International Technology, Mitsubishi Electric Power Products, Mutlu Battery, Nimac Power Systems, PT GS Battery, PT Motobatt Indonesia, The Furukawa Battery, and Yokohama Group. These manufacturers and suppliers are focusing on innovation, efficiency improvements, and regional distribution expansion to strengthen their positions in a market driven by both primary sales and recurring replacement demand.
Table of Contents
Chapter 1 Methodology & Scope
- 1.1 Research design
- 1.2 Market estimates & forecast parameters
- 1.3 Forecast calculation
- 1.4 Data sources
- 1.4.1 Primary
- 1.4.2 Secondary
- 1.4.2.1 Paid
- 1.4.2.2 Public
- 1.5 Market definitions
Chapter 2 Industry Insights
- 2.1 Industry ecosystem analysis
- 2.2 Regulatory landscape
- 2.3 Industry impact forces
- 2.3.1 Growth drivers
- 2.3.2 Industry pitfalls & challenges
- 2.4 Growth potential analysis
- 2.5 Porter's analysis
- 2.5.1 Bargaining power of suppliers
- 2.5.2 Bargaining power of buyers
- 2.5.3 Threat of new entrants
- 2.5.4 Threat of substitutes
- 2.6 PESTEL analysis
- 2.7 Cost structure analysis of lead acid batteries
- 2.8 Price trend analysis
- 2.8.1 By application
- 2.8.2 By construction
- 2.8.3 Emerging opportunities & trends
- 2.8.3.1 Digitalization & IoT integration
- 2.8.3.2 Emerging market penetration
- 2.8.4 Investment analysis & future outlook
Chapter 3 Competitive Landscape, 2025
- 3.1 Introduction
- 3.2 Company market share analysis, by country, 2024
- 3.2.1 Indonesia
- 3.2.2 Malaysia
- 3.3 Strategic dashboard
- 3.4 Strategic initiatives
- 3.5 Competitive benchmarking
- 3.6 Innovation & technology landscape
Chapter 4 Market Size and Forecast, By Application, 2021 - 2034 (USD Million & Million Units)
- 4.1 Key trends
- 4.2 Stationary
- 4.2.1 Telecommunications
- 4.2.2 UPS
- 4.2.3 Control & switchgear
- 4.2.4 Others
- 4.3 Motive
- 4.4 SLI
- 4.4.1 Automobiles
- 4.4.2 Motorcycles
Chapter 5 Market Size and Forecast, By Construction, 2021 - 2034 (USD Million & Million Units)
- 5.1 Key trends
- 5.2 Flooded
- 5.3 VRLA
- 5.3.1 AGM
- 5.3.2 GEL
Chapter 6 Market Size and Forecast, By Sales Channel, 2021 - 2034 (USD Million & Million Units)
- 6.1 Key trends
- 6.2 OEM
- 6.3 Aftermarket
Chapter 7 Market Size and Forecast, By Country, 2021 - 2034 (USD Million & Million Units)
- 7.1 Key trends
- 7.2 Indonesia
- 7.3 Malaysia
Chapter 8 Company Profiles
- 8.1 ABM FUJIYA
- 8.2 Amara Raja Energy & Mobility
- 8.3 C&D Technologies
- 8.4 CENTURY BATTERIES INDONESIA
- 8.5 Century Yuasa Batteries
- 8.6 Clarios
- 8.7 EnerSys
- 8.8 EXIDE INDUSTRIES
- 8.9 GP Marketing
- 8.10 GS Yuasa International
- 8.11 HOPPECKE
- 8.12 JYC BATTERY MANUFACTURER
- 8.13 leoch International Technology
- 8.14 Mitsubishi Electric Power Products
- 8.15 Mutlu Battery
- 8.16 NIMAC POWER SYSTEMS
- 8.17 PT GS BATTERY
- 8.18 PT. Motobatt Indonesia
- 8.19 THE FURUKAWA BATTERY
- 8.20 Yokohama Group

