
PUBLISHER: Global Market Insights Inc. | PRODUCT CODE: 1666695

PUBLISHER: Global Market Insights Inc. | PRODUCT CODE: 1666695
High Temperature Overhead Conductor Market Opportunity, Growth Drivers, Industry Trend Analysis, and Forecast 2025 - 2034
The Global High Temperature Overhead Conductor Market, valued at USD 230.8 million in 2024, is projected to grow at a CAGR of 4.8% from 2025 to 2034. This growth is driven by the increasing demand for energy, the need to upgrade transmission systems, and a growing emphasis on enhancing grid resilience. With the rising demand for electricity and the integration of renewable energy sources, utilities, and transmission operators are increasingly turning to high-temperature conductors to replace aging infrastructure and meet modern energy needs. High-temperature conductors play a key role in transmitting power from renewable sources over longer distances, facilitating sustainable energy transitions.
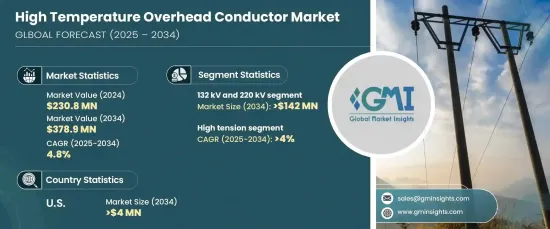
Innovative materials are helping to boost market growth. Technologies such as carbon fiber-reinforced composites, aluminum composite core conductors, and advanced alloy conductors are gaining traction. These materials offer enhanced conductivity, reduced sag, and better thermal resistance, all of which make them ideal for accommodating growing energy demands. The market for 132 kV and 220 kV conductors, for example, is expected to see steady growth as urbanization and commercial developments create more demand for higher voltage solutions. As renewable energy sources become more widely used and distributed generation technologies evolve, these conductors are becoming integral to modernizing power grids and meeting expanding electricity needs.
| Market Scope | |
|---|---|
| Start Year | 2024 |
| Forecast Year | 2025-2034 |
| Start Value | $230.8 Million |
| Forecast Value | $378.9 Million |
| CAGR | 4.8% |
The high-tension (HT) overhead conductor market is also expected to grow at a solid pace, with a CAGR of over 4% by 2034. HT conductors have become essential for larger transmission projects due to their ability to support substantial transmission capacities. The rapid rise in energy demand and the increasing focus on reliable, uninterrupted power supply are key factors that will propel this segment. Additionally, the growing need for more energy-efficient and sustainable solutions is driving the adoption of advanced conductor technologies that meet both technical and aesthetic requirements.
In the U.S., the high-temperature overhead conductor market is expected to surpass USD 4 million by 2034, primarily due to grid modernization efforts and rising electricity demand. The shift toward renewable energy requires advanced conductors that can manage higher thermal loads while ensuring efficient transmission. These conductors are gaining popularity as utilities invest in grid resilience and comply with increasing regulatory demands for energy efficiency and sustainability.
The Asia Pacific region is also poised for significant growth in the high-temperature overhead conductor market. Emerging economies like China and India are expected to be key drivers of this expansion as they modernize their electric infrastructure and increase power capacity. With rising investments in energy transmission and distribution, along with growing power consumption in both residential and commercial sectors, the demand for advanced overhead conductors will continue to rise in the coming years.
Table of Contents
Chapter 1 Methodology & Scope
- 1.1 Market scope & definitions
- 1.2 Market estimates & forecast parameters
- 1.3 Forecast calculation
- 1.4 Data sources
- 1.4.1 Primary
- 1.4.2 Secondary
- 1.4.2.1 Paid
- 1.4.2.2 Public
Chapter 2 Executive Summary
- 2.1 Industry synopsis, 2021 - 2034
Chapter 3 Industry Insights
- 3.1 Industry ecosystem analysis
- 3.2 Regulatory landscape
- 3.3 Industry impact forces
- 3.3.1 Growth drivers
- 3.3.2 Industry pitfalls & challenges
- 3.4 Growth potential analysis
- 3.5 Porter's analysis
- 3.5.1 Bargaining power of suppliers
- 3.5.2 Bargaining power of buyers
- 3.5.3 Threat of new entrants
- 3.5.4 Threat of substitutes
- 3.6 PESTEL analysis
Chapter 4 Competitive Landscape, 2024
- 4.1 Introduction
- 4.2 Strategic outlook
- 4.3 Innovation & sustainability landscape
Chapter 5 Market Size and Forecast, By Product, 2021 – 2034 (km, USD Million)
- 5.1 Key trends
- 5.2 Tal
- 5.3 ZTAl
- 5.4 Others
Chapter 6 Market Size and Forecast, By Voltage, 2021 – 2034 (km, USD Million)
- 6.1 Key trends
- 6.2 132 kV to 220 kV
- 6.3 > 220 kV to 660 kV
- 6.4 > 660 kV
Chapter 7 Market Size and Forecast, By Rated Strength, 2021 – 2034 (km, USD Million)
- 7.1 Key trends
- 7.2 High strength
- 7.3 Extra high strength
- 7.4 Ultra high strength
Chapter 8 Market Size and Forecast, By Application, 2021 – 2034 (km, USD Million)
- 8.1 Key trends
- 8.2 High tension
- 8.3 Extra high tension
- 8.4 Ultra high tension
Chapter 9 Market Size and Forecast, By Region, 2021 – 2034 (km, USD Million)
- 9.1 Key trends
- 9.2 North America
- 9.2.1 U.S.
- 9.2.2 Canada
- 9.2.3 Mexico
- 9.3 Europe
- 9.3.1 UK
- 9.3.2 Italy
- 9.3.3 Germany
- 9.3.4 Sweden
- 9.3.5 Denmark
- 9.4 Asia Pacific
- 9.4.1 China
- 9.4.2 Australia
- 9.4.3 India
- 9.4.4 Japan
- 9.4.5 South Korea
- 9.5 Middle East & Africa
- 9.5.1 Saudi Arabia
- 9.5.2 UAE
- 9.5.3 South Africa
- 9.6 Latin America
- 9.6.1 Brazil
- 9.6.2 Argentina
Chapter 10 Company Profiles
- 10.1 3M
- 10.2 Apar Industries
- 10.3 CTC Global
- 10.4 Elsewedy Electric
- 10.5 Hendrix Wire and Cable
- 10.6 J-Power Systems
- 10.7 Kec International
- 10.8 Lamifil
- 10.9 Nexans
- 10.10 Prysmian Group
- 10.11 Southwire Company
- 10.12 Sterlite Power
- 10.13 Sumitomo Electric Industries
- 10.14 SWCC Showa Holdings
- 10.15 Trefinasa

