
PUBLISHER: Global Market Insights Inc. | PRODUCT CODE: 1666960

PUBLISHER: Global Market Insights Inc. | PRODUCT CODE: 1666960
Rod Artificial Lift System Market Opportunity, Growth Drivers, Industry Trend Analysis, and Forecast 2025 - 2034
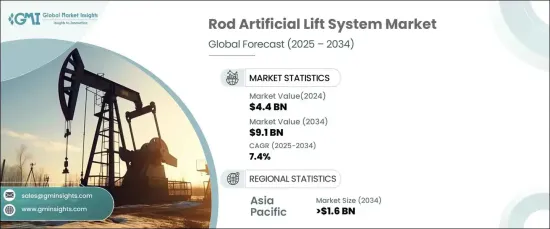
The Global Rod Artificial Lift System Market, valued at USD 4.4 billion in 2024, is projected to expand at a CAGR of 7.4% between 2025 and 2034. This significant growth is primarily driven by the increasing demand for efficient hydrocarbon extraction solutions from aging and low-pressure wells. As operators continue to seek cost-effective, reliable, and adaptable systems for varying well conditions, the need for these systems is growing, particularly in the development of new oilfields and unconventional reserves.
The market expansion is also being fueled by technological advancements, including automation and enhanced materials that improve system durability and efficiency. With a global shift toward sustainable energy solutions, the push for energy-efficient artificial lift systems is further propelling market demand. Additionally, heightened investments in energy infrastructure and favorable regulatory environments are contributing to the rapid adoption of these systems across key regions.
| Market Scope | |
|---|---|
| Start Year | 2024 |
| Forecast Year | 2025-2034 |
| Start Value | $4.4 Billion |
| Forecast Value | $9.1 Billion |
| CAGR | 7.4% |
The Asia Pacific region is set to contribute USD 1.6 billion to the global market value by 2034. The region's growing oil and gas exploration, particularly in aging fields and unconventional reservoirs, is accelerating the need for rod artificial lift systems. As countries like China, India, and those in Southeast Asia continue to boost energy production, these systems are becoming indispensable for maintaining optimal output from mature wells. Technological innovations and government support for energy sector investments are further driving this demand. The rise in energy demands, along with a push for more sustainable extraction processes, ensures that these systems will play a central role in the region's oil and gas sector.
In North America, the rod artificial lift systems market is poised to grow at a steady pace of 7% between 2025 and 2034. The expansion is largely driven by the increasing exploration and production activities in unconventional oil and gas reserves, especially in shale formations. The demand for efficient solutions to enhance output from low-pressure wells is contributing to the market growth. Technological advancements, including improvements in materials for increased durability and the integration of real-time monitoring, are also bolstering the market development. Furthermore, favorable government policies and substantial investments in oilfield infrastructure are reinforcing the adoption of rod artificial lift systems across the region.
The U.S. rod artificial lift systems market is anticipated to generate USD 5 billion by 2034, with a growing emphasis on optimizing production in both mature and unconventional oil fields. As operators target shale reservoirs and aging wells, the demand for cost-effective, high-performance solutions is surging. Technological innovations, such as advancements in material strength and automation for enhanced performance, are supporting this trend. The rising need for energy security, coupled with significant investments in oilfield infrastructure, is further driving market expansion, positioning the U.S. as a key player in the rod artificial lift systems market.
Table of Contents
Chapter 1 Methodology & Scope
- 1.1 Market definitions
- 1.2 Base estimates & calculations
- 1.3 Forecast calculation
- 1.4 Data sources
- 1.4.1 Primary
- 1.4.2 Secondary
- 1.4.2.1 Paid
- 1.4.2.2 Public
Chapter 2 Executive Summary
- 2.1 Industry synopsis, 2021 - 2034
Chapter 3 Industry Insights
- 3.1 Industry ecosystem analysis
- 3.2 Regulatory landscape
- 3.3 Industry impact forces
- 3.3.1 Growth drivers
- 3.3.2 Industry pitfalls & challenges
- 3.4 Growth potential analysis
- 3.5 Porter's analysis
- 3.5.1 Bargaining power of suppliers
- 3.5.2 Bargaining power of buyers
- 3.5.3 Threat of new entrants
- 3.5.4 Threat of substitutes
- 3.6 PESTEL analysis
Chapter 4 Competitive Landscape, 2024
- 4.1 Strategic dashboard
- 4.2 Innovation & sustainability landscape
Chapter 5 Market Size and Forecast, By Region, 2021 – 2034 (USD Million)
- 5.1 Key trends
- 5.2 North America
- 5.2.1 U.S.
- 5.2.2 Canada
- 5.3 Europe
- 5.3.1 UK
- 5.3.2 Norway
- 5.3.3 Netherlands
- 5.4 Asia Pacific
- 5.4.1 China
- 5.4.2 India
- 5.4.3 Indonesia
- 5.4.4 Malaysia
- 5.5 Middle East & Africa
- 5.5.1 Saudi Arabia
- 5.5.2 UAE
- 5.5.3 Oman
- 5.5.4 Kuwait
- 5.5.5 Nigeria
- 5.6 Latin America
- 5.6.1 Brazil
- 5.6.2 Argentina
- 5.6.3 Mexico
Chapter 6 Company Profiles
- 6.1 BCP Group
- 6.2 ChampionX
- 6.3 ELKAM ArtEfficial Lift
- 6.4 Endurance Lift Solutions International
- 6.5 General Electric
- 6.6 Halliburton
- 6.7 JJ Tech
- 6.8 Levare
- 6.9 Liberty Lift Solutions
- 6.10 National Energy Services Reunited
- 6.11 NOV
- 6.12 NOVA Petroleum Services
- 6.13 PetroLift Systems
- 6.14 Q2 Artificial Lift Services
- 6.15 SLB
- 6.16 Tenaris
- 6.17 Weatherford

