
PUBLISHER: Global Market Insights Inc. | PRODUCT CODE: 1721502

PUBLISHER: Global Market Insights Inc. | PRODUCT CODE: 1721502
Equestrian Apparel Market Opportunity, Growth Drivers, Industry Trend Analysis, and Forecast 2025 - 2034
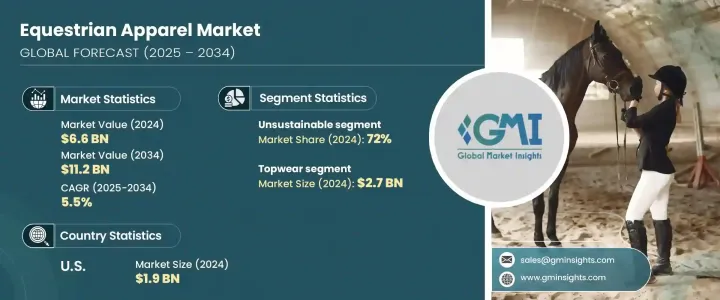
The Global Equestrian Apparel Market was valued at USD 6.6 billion in 2024 and is estimated to grow at a CAGR of 5.5% to reach USD 11.2 billion by 2034. This growth reflects a combination of lifestyle shifts, increased recreational activity, and a renewed interest in horseback riding across both rural and urban communities. As equestrian sports gain broader visibility through media coverage and social platforms, more people are being drawn to the discipline-ranging from professional athletes to hobbyists and young enthusiasts. The sport's cultural appeal, combined with the desire for outdoor engagement and wellness, is fueling a strong consumer appetite for specialized apparel that blends performance, functionality, and fashion. Moreover, equestrian clothing is gaining popularity beyond riding circles as it influences mainstream fashion with its blend of utility and sophistication. As a result, manufacturers and designers are expanding their collections to cater to both traditional riders and lifestyle consumers. Comfort, durability, and style are emerging as top priorities, while brands continue to align themselves with sustainability goals to appeal to the eco-conscious buyer.
Rising participation in equestrian sports, a surge in outdoor activities, and a growing base of recreational riders are the primary drivers of market demand. As more individuals embrace horseback riding as a hobby or competitive pursuit, there is a notable rise in demand for high-performance yet stylish apparel such as tops, bottoms, outerwear, gloves, boots, and helmets. Female riders continue to dominate the market, though the increasing presence of younger riders and male participants is expanding the industry's demographic reach. Buyers are now seeking gear that offers a balance of comfort and design, leading to product innovations that prioritize mobility, breathability, and rider safety.
| Market Scope | |
|---|---|
| Start Year | 2024 |
| Forecast Year | 2025-2034 |
| Start Value | $6.6 Billion |
| Forecast Value | $11.2 Billion |
| CAGR | 5.5% |
The topwear segment alone generated USD 2.7 billion in 2024, driven by competitive and leisure riding needs. Show shirts remain a favorite among professional riders for their moisture-wicking capabilities and long-wear comfort during events. Polo shirts, known for their versatility, serve as both casual wear and functional riding apparel, while show jackets, crafted with flexible and breathable fabrics, have become essential for riders competing at various levels by offering both a polished look and practical comfort.
Although sustainable apparel is gaining traction, the unsustainable segment held a dominant 72% market share in 2024 and is expected to grow at a CAGR of 4.3% through 2034. Affordability continues to drive the use of synthetic materials and petroleum-based textiles despite environmental drawbacks. Fast fashion practices still prevail, often relying on non-recyclable components and harmful chemicals. However, demand for sustainable equestrian apparel is rising, with the segment expected to reach USD 1.8 billion as consumers seek organic cotton, recycled fabrics, and ethically produced options.
The U.S. equestrian apparel market alone generated USD 1.9 billion in 2024. Demand remains strong for premium, performance-oriented clothing that emphasizes durability, comfort, and innovation. American consumers are increasingly gravitating toward eco-friendly brands. While online platforms enhance shopping convenience, specialty stores continue to deliver value through custom fittings and expert consultations.
Leading companies in the equestrian apparel industry include Equi-Star, Ariat International, Samshield, Charles Owen, Dublin, Eskadron, Goode Rider, Kingsland Equestrian, Helite, Horze, Kentucky Horsewear, Pikeur, Riders International, and Tredstep Ireland. To strengthen their market presence, these brands are prioritizing advanced R&D to enhance apparel functionality. Many are also adopting sustainable materials and ethical production processes to meet evolving consumer expectations and reinforce long-term brand loyalty.
Table of Contents
Chapter 1 Methodology and Scope
- 1.1 Market scope and definitions
- 1.2 Base estimates & calculations
- 1.3 Forecast calculation
- 1.4 Data sources
- 1.4.1 Primary
- 1.4.2 Secondary
- 1.4.2.1 Paid sources
- 1.4.2.2 Public sources
Chapter 2 Executive Summary
- 2.1 Industry 3600 synopsis
Chapter 3 Industry Insights
- 3.1 Industry ecosystem analysis
- 3.1.1 Factor affecting the value chain
- 3.1.2 Profit margin analysis
- 3.1.3 Disruptions
- 3.1.4 Future outlook
- 3.1.5 Manufacturers
- 3.1.6 Distributors
- 3.2 Supplier landscape
- 3.3 Profit margin analysis
- 3.4 Key news & initiatives
- 3.5 Regulatory landscape
- 3.6 Industry impact forces
- 3.6.1 Growth drivers
- 3.6.1.1 Increased interest in equestrian activities is driving demand for specialized apparel and gear.
- 3.6.1.2 Consumers are increasingly seeking eco-friendly and ethically sourced equestrian apparel.
- 3.6.1.3 Innovation in performance fabrics, such as moisture-wicking and breathable materials, enhances comfort and functionality.
- 3.6.2 Industry pitfalls and challenges
- 3.6.2.1 The expensive nature of high-end equestrian apparel limits accessibility for budget-conscious consumers.
- 3.6.2.2 Equestrian apparel sales can be affected by seasonal variations in weather and riding events.
- 3.6.1 Growth drivers
- 3.7 Growth potential analysis
- 3.8 Porter’s analysis
- 3.9 PESTEL analysis
Chapter 4 Competitive Landscape, 2024
- 4.1 Introduction
- 4.2 Company market share analysis
- 4.3 Competitive positioning matrix
- 4.4 Strategic outlook matrix
Chapter 5 Market Estimates and Forecast, By Product type, 2021 - 2034 (USD Bn) (Million Units)
- 5.1 Key trends
- 5.2 Topwear
- 5.2.1 Showshirts
- 5.2.2 Poloshirts
- 5.2.3 Showjackets
- 5.2.4 Other (outwear, etc)
- 5.3 Bottomwear
- 5.3.1 Breeches/riding pants
- 5.3.2 Tights
- 5.3.3 Other (thermal etc.)
- 5.4 Other (socks etc)
Chapter 6 Market Estimates and Forecast, By Apparel, 2021 - 2034 (USD Bn) (Million Units)
- 6.1 Key trends
- 6.2 Sustainable
- 6.3 Unsustainable
Chapter 7 Market Estimates and Forecast, By Category, 2021 - 2034 (USD Bn) (Million Units)
- 7.1 Key trends
- 7.2 Professional rider
- 7.3 Recreational rider
Chapter 8 Market Estimates and Forecast, By Consumer Group 2021 - 2034 (USD Bn) (Million Units)
- 8.1 Key trends
- 8.2 Male
- 8.3 Female
- 8.4 Children
Chapter 9 Market Estimates and Forecast, By Price Range 2021 - 2034 (USD Bn) (Million Units)
- 9.1 Key trends
- 9.2 Low
- 9.3 Mid
- 9.4 High
Chapter 10 Market Estimates and Forecast, By Distribution Channel 2021 - 2034 (USD Bn) (Million Units)
- 10.1 Key trends
- 10.2 Online
- 10.2.1 E-Commerce websites
- 10.2.2 Company websites
- 10.3 Offline
- 10.3.1 Speciality stores
- 10.3.2 Hypermarkets & supermarkets
- 10.3.3 Others (departmental stores, etc.)
Chapter 11 Market Estimates and Forecast, By Region, 2021 - 2034 (USD Bn) (Million Units)
- 11.1 Key trends
- 11.2 North America
- 11.2.1 U.S.
- 11.2.2 Canada
- 11.3 Europe
- 11.3.1 Germany
- 11.3.2 UK
- 11.3.3 France
- 11.3.4 Spain
- 11.3.5 Italy
- 11.3.6 Netherlands
- 11.4 Asia Pacific
- 11.4.1 China
- 11.4.2 India
- 11.4.3 Japan
- 11.4.4 Australia
- 11.4.5 South Korea
- 11.5 Latin America
- 11.5.1 Brazil
- 11.5.2 Mexico
- 11.5.3 Argentina
- 11.6 Middle East and Africa
- 11.6.1 Saudi Arabia
- 11.6.2 South Africa
- 11.6.3 UAE
Chapter 12 Company Profiles
- 12.1 Ariat International
- 12.2 Charles Owen
- 12.3 Dublin
- 12.4 Equi-Star
- 12.5 Eskadron
- 12.6 Goode Rider
- 12.7 Helite
- 12.8 Horze
- 12.9 Kentucky Horsewear
- 12.10 Kingsland Equestrian
- 12.11 Pikeur
- 12.12 Riders International
- 12.13 Samshield
- 12.14 Tredstep Ireland

