
PUBLISHER: Global Market Insights Inc. | PRODUCT CODE: 1667161

PUBLISHER: Global Market Insights Inc. | PRODUCT CODE: 1667161
U.S. Oil and Gas Analytics Market Opportunity, Growth Drivers, Industry Trend Analysis, and Forecast 2025 - 2034
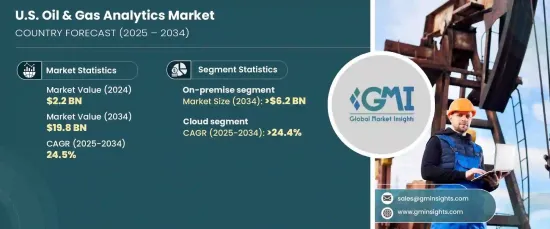
U.S. Oil And Gas Analytics Market reached USD 2.2 billion in 2024 and is projected to grow at a CAGR of 24.5% from 2025 to 2034. This growth is fueled by the increasing adoption of data-driven strategies and advancements in digital technologies. Analytics is transforming the industry by streamlining exploration, production, and distribution processes, enabling companies to achieve higher efficiency while reducing operational costs.
The integration of artificial intelligence (AI), machine learning, and predictive analytics is revolutionizing decision-making in the oil and gas sector. These technologies provide real-time insights, enabling better asset management, resource allocation, and operational planning. Additionally, the rising shift toward cloud-based solutions offers businesses the scalability and flexibility needed to adapt to dynamic market demands, further driving the adoption of analytics platforms.
| Market Scope | |
|---|---|
| Start Year | 2024 |
| Forecast Year | 2025-2034 |
| Start Value | $2.2 Billion |
| Forecast Value | $19.8 Billion |
| CAGR | 24.5% |
As organizations increasingly rely on advanced data analysis to optimize their operations, analytics tools have become indispensable. They turn vast amounts of raw data into actionable insights, helping to enhance efficiency and minimize downtime. By leveraging these solutions, companies can predict potential failures, improve operational reliability, and lower overall costs, contributing to greater profitability.
The market also highlights the growing role of on-premise solutions, which are expected to generate USD 6.2 billion by 2034. These systems allow companies to maintain complete control over their analytics infrastructure, ensuring compliance with industry regulations and safeguarding sensitive data. On-premise platforms are particularly valued in environments where security and control are critical, offering detailed insights into performance, maintenance, and process optimization.
Meanwhile, cloud-based analytics is emerging as a key growth driver, projected to expand at a CAGR of 24.4% during 2025-2034. Cloud platforms provide cost-effective, scalable solutions that enable real-time data access and seamless integration across operations. These systems facilitate enhanced collaboration and support predictive analytics, allowing businesses to optimize production processes while mitigating risks associated with remote operations.
The surge in demand for advanced analytics tools reflects the industry's growing focus on digital transformation and operational excellence. By adopting innovative solutions, oil and gas companies are better equipped to navigate the challenges of an evolving energy landscape. This market is set to play a pivotal role in driving efficiency and sustainability, shaping the future of the U.S. oil and gas sector.
Table of Contents
Chapter 1 Methodology & Scope
- 1.1 Market definitions
- 1.2 Base estimates & calculations
- 1.3 Forecast calculation
- 1.4 Data sources
- 1.4.1 Primary
- 1.4.2 Secondary
- 1.4.2.1 Paid
- 1.4.2.2 Public
Chapter 2 Industry Insights
- 2.1 Industry ecosystem analysis
- 2.2 Regulatory landscape
- 2.3 Industry impact forces
- 2.3.1 Growth drivers
- 2.3.2 Industry pitfalls & challenges
- 2.4 Growth potential analysis
- 2.5 Porter's analysis
- 2.5.1 Bargaining power of suppliers
- 2.5.2 Bargaining power of buyers
- 2.5.3 Threat of new entrants
- 2.5.4 Threat of substitutes
- 2.6 PESTEL analysis
Chapter 3 Competitive landscape, 2024
- 3.1 Strategic dashboard
- 3.2 Innovation & sustainability landscape
Chapter 4 Market Size and Forecast, By Deployment, 2021 – 2034 (USD Million)
- 4.1 Key trends
- 4.2 On premise
- 4.3 Hosted
Chapter 5 Market Size and Forecast, By Application, 2021 – 2034 (USD Million)
- 5.1 Key trends
- 5.2 Upstream
- 5.2.1 Exploration and drilling
- 5.2.2 Field surveillance and monitoring
- 5.2.3 Production planning and forecasting
- 5.2.4 Equipment maintenance management
- 5.2.5 Asset performance
- 5.2.6 Workforce management
- 5.3 Midstream
- 5.3.1 Pipeline SCADA
- 5.3.2 Fleet
- 5.3.3 Storage optimization
- 5.4 Downstream
- 5.4.1 Commodity trading
- 5.4.2 Demand forecasting
- 5.4.3 Pricing
- 5.4.4 Refining
Chapter 6 Market Size and Forecast, By Service, 2021 – 2034 (USD Million)
- 6.1 Key trends
- 6.2 Professional
- 6.3 Cloud
- 6.4 Integration
Chapter 7 Company Profiles
- 7.1 Accenture
- 7.2 Capgemini
- 7.3 Cisco Systems
- 7.4 Cognizant
- 7.5 Deloitte
- 7.6 Hewlett Packard Enterprise
- 7.7 Hitachi
- 7.8 IBM
- 7.9 Microsoft
- 7.10 Oracle
- 7.11 SAP
- 7.12 SAS Institute
- 7.13 Tableau Software
- 7.14 Teradata
- 7.15 TIBCO Software

