
PUBLISHER: Global Market Insights Inc. | PRODUCT CODE: 1667089

PUBLISHER: Global Market Insights Inc. | PRODUCT CODE: 1667089
Asia Pacific Oil Storage Market Opportunity, Growth Drivers, Industry Trend Analysis, and Forecast 2025 - 2034
Asia Pacific Oil Storage Market is poised for significant growth, with its size estimated at 396.2 million cubic meters in 2024. The market is projected to expand at a CAGR of 2.9% from 2025 to 2034. This growth is fueled by increasing energy demand, the expansion of refining capacities, and the region's strategic position in the global oil trade. The market's expansion reflects a growing focus on enhancing storage infrastructure to ensure energy security and efficiently manage fluctuations in oil prices.
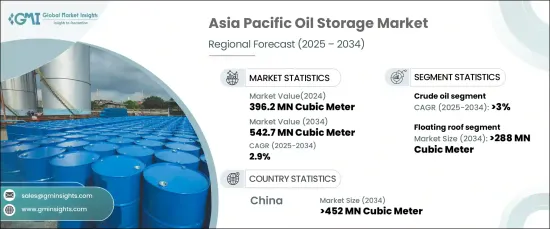
Oil storage infrastructure is becoming increasingly important in managing energy supply dynamics, particularly with the rising demand for refined petroleum products. Floating roof tanks are emerging as a preferred choice for oil storage, with their capacity expected to surpass 288 million cubic meters by 2034. These tanks are specifically designed to minimize evaporation losses and reduce environmental emissions. Recent advancements in sealing systems and construction materials have improved their reliability and operational performance, helping operators meet strict environmental regulations.
The crude oil storage segment is also witnessing robust growth, with a projected CAGR of over 3% through 2034. This segment plays a critical role in managing variations in oil production and meeting the demand for refined fuels such as gasoline, diesel, and jet fuel. The rising demand for efficient storage solutions is driving upgrades in storage infrastructure, which increasingly incorporates advanced monitoring and automation technologies. These innovations enhance safety, streamline operations, and ensure compliance with environmental standards.
Additionally, the market is witnessing a trend toward integrating capacity expansion with technological advancements. Newer facilities are equipped with sophisticated systems designed to enhance operational efficiency and mitigate environmental impacts. These initiatives are critical in maintaining a sustainable and efficient oil storage ecosystem.
By 2034, the Asia Pacific oil storage market is expected to experience further growth, driven by increasing investments in infrastructure and the adoption of innovative storage solutions. Enhanced storage capacity, combined with cutting-edge technologies, is ensuring the market remains well-positioned to address evolving energy demands and regulatory challenges. With a focus on sustainability and efficiency, the oil storage market in Asia Pacific is set to play a pivotal role in supporting the region's energy requirements in the coming decade.
Table of Contents
Chapter 1 Methodology & Scope
- 1.1 Market scope & definitions
- 1.2 Market estimates & forecast parameters
- 1.3 Forecast calculation
- 1.4 Data sources
- 1.4.1 Primary
- 1.4.2 Secondary
- 1.4.2.1 Paid
- 1.4.2.2 Public
Chapter 2 Industry Insights
- 2.1 Industry ecosystem analysis
- 2.2 Regulatory landscape
- 2.3 Industry impact forces
- 2.3.1 Growth drivers
- 2.3.2 Industry pitfalls & challenges
- 2.4 Growth potential analysis
- 2.5 Porter's analysis
- 2.5.1 Bargaining power of suppliers
- 2.5.2 Bargaining power of buyers
- 2.5.3 Threat of new entrants
- 2.5.4 Threat of substitutes
- 2.6 PESTEL analysis
Chapter 3 Competitive Landscape, 2024
- 3.1 Introduction
- 3.2 Strategic outlook
- 3.3 Innovation & sustainability landscape
Chapter 4 Market Size and Forecast, By Product, 2021 – 2034 (Million Cubic Meter)
- 4.1 Key trends
- 4.2 Fixed roof
- 4.3 Floating roof
- 4.4 Spherical
- 4.5 Others
Chapter 5 Market Size and Forecast, By End Use, 2021 – 2034 (Million Cubic Meter)
- 5.1 Key trends
- 5.2 Crude oil
- 5.3 Gasoline
- 5.4 Aviation fuel
- 5.5 Middle distillates
- 5.6 LNG
- 5.7 LPG
Chapter 6 Market Size and Forecast, By Country, 2021 – 2034 (Million Cubic Meter)
- 6.1 Key trends
- 6.2 China
- 6.3 Japan
- 6.4 South Korea
- 6.5 Singapore
- 6.6 Malaysia
- 6.7 Indonesia
Chapter 7 Company Profiles
- 7.1 Anson International
- 7.2 China National Offshore Oil
- 7.3 CST Industries
- 7.4 Ergil
- 7.5 Indian Oil
- 7.6 Korea National Oil
- 7.7 NOV
- 7.8 Oil and Natural Gas
- 7.9 Petron
- 7.10 Reliance Industries
- 7.11 Royal Vopak
- 7.12 Shawcor
- 7.13 Sinopec
- 7.14 SK Energy
- 7.15 Superior Tank
- 7.16 T Bailey
- 7.17 Waterford Tank & Fabrication

