
PUBLISHER: Global Market Insights Inc. | PRODUCT CODE: 1666670

PUBLISHER: Global Market Insights Inc. | PRODUCT CODE: 1666670
North America Oil Storage Market Opportunity, Growth Drivers, Industry Trend Analysis, and Forecast 2025 - 2034
North America Oil Storage Market was recorded at 166.2 million cubic meters in capacity in 2024 and is anticipated to grow at a CAGR of 2.4% during 2025-2034. This growth is driven by the rising need for storage capacity due to varying oil production and utilization trends, especially in the U.S. Evolving market dynamics, including supply-demand imbalances and the growing focus on energy security, are further propelling the demand for efficient oil storage solutions.
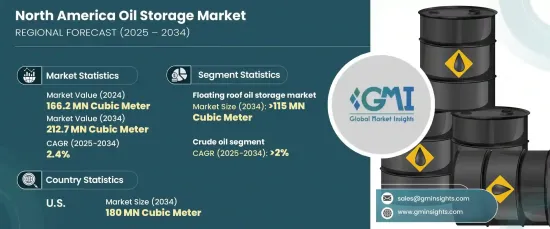
Floating roof tanks are projected to reach 115 million cubic meters in capacity by 2034. These tanks are increasingly favored for their ability to reduce evaporation losses and minimize environmental emissions, making them ideal for volatile liquids like crude oil and refined petroleum products. Recent advancements in sealing technologies and construction materials have enhanced their efficiency and environmental compliance, further solidifying their role in modern storage infrastructure.
The crude oil storage segment in North America is expected to grow at a CAGR of 2% through 2034. This segment remains vital, driven by fluctuating production levels and the growing need for refined product storage. Rising demand for gasoline, diesel, and jet fuel has prompted infrastructure upgrades that expand storage capacity while integrating advanced monitoring systems for improved safety and operational efficiency. These upgrades are designed to meet stricter environmental and regulatory standards, ensuring sustainable growth in the oil storage industry.
U.S. oil storage market is poised to generate 180 million cubic meters by 2034, maintaining its dominance in the region. This growth is fueled by robust shale oil production and increasing export activities, which have created a heightened need for strategic and private storage facilities. Expanding petroleum reserves and investments in storage infrastructure are helping to stabilize output and mitigate market fluctuations, strengthening the country's position in the global oil market.
Regulatory initiatives promoting eco-friendly and efficient storage practices are encouraging the adoption of advanced solutions designed to meet environmental standards. This shift not only supports operational safety but also aligns with the industry's focus on sustainability and performance optimization.
With growing energy demands, evolving technologies, and regulatory pressures, the North America oil storage market is set to achieve steady expansion over the next decade, catering to both regional and global energy needs.
Table of Contents
Chapter 1 Methodology & Scope
- 1.1 Market scope & definitions
- 1.2 Market estimates & forecast parameters
- 1.3 Forecast calculation
- 1.4 Data sources
- 1.4.1 Primary
- 1.4.2 Secondary
- 1.4.2.1 Paid
- 1.4.2.2 Public
Chapter 2 Industry Insights
- 2.1 Industry ecosystem analysis
- 2.2 Regulatory landscape
- 2.3 Industry impact forces
- 2.3.1 Growth drivers
- 2.3.2 Industry pitfalls & challenges
- 2.4 Growth potential analysis
- 2.5 Porter's Analysis
- 2.5.1 Bargaining power of suppliers
- 2.5.2 Bargaining power of buyers
- 2.5.3 Threat of new entrants
- 2.5.4 Threat of substitutes
- 2.6 PESTEL Analysis
Chapter 3 Competitive Landscape, 2024
- 3.1 Introduction
- 3.2 Strategic outlook
- 3.3 Innovation & sustainability landscape
Chapter 4 Market Size and Forecast, By Product, 2021 – 2034 (Million Cubic Meter)
- 4.1 Key trends
- 4.2 Fixed roof
- 4.3 Floating roof
- 4.4 Spherical
- 4.5 Others
Chapter 5 Market Size and Forecast, By End Use, 2021 – 2034 (Million Cubic Meter)
- 5.1 Key trends
- 5.2 Crude oil
- 5.3 Gasoline
- 5.4 Aviation fuel
- 5.5 Middle distillates
- 5.6 LNG
- 5.7 LPG
Chapter 6 Market Size and Forecast, By Country, 2021 – 2034 (Million Cubic Meter)
- 6.1 Key trends
- 6.2 U.S.
- 6.3 Canada
- 6.4 Mexico
Chapter 7 Company Profiles
- 7.1 Ascent Industries
- 7.2 CST Industries
- 7.3 Ergil
- 7.4 Fisher Tank
- 7.5 LF Manufacturing
- 7.6 NOV
- 7.7 Roth Industries
- 7.8 Royal Vopak
- 7.9 Shawcor
- 7.10 Snyder Industries
- 7.11 Superior Tank
- 7.12 T Bailey
- 7.13 Waterford Tank

