
PUBLISHER: Global Market Insights Inc. | PRODUCT CODE: 1667046

PUBLISHER: Global Market Insights Inc. | PRODUCT CODE: 1667046
Low Voltage Electric Capacitor Market Opportunity, Growth Drivers, Industry Trend Analysis, and Forecast 2025 - 2034
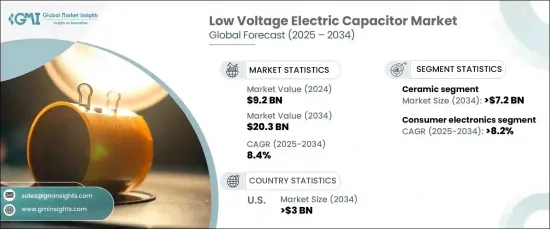
The Global Low Voltage Electric Capacitor Market, valued at USD 9.2 billion in 2024, is set to witness robust growth, projected to expand at a CAGR of 8.4% from 2025 to 2034. This upward trajectory is driven by advancements in industrial automation, the increasing integration of renewable energy sources, and the growing demand for energy-efficient electrical systems. As industries worldwide adopt smart grid technologies and automation, the need for low voltage capacitors to reduce energy losses and enhance power factor correction is surging. These capacitors are critical in optimizing energy distribution, ensuring efficiency, and supporting the shift toward more sustainable energy solutions.
The global emphasis on renewable energy projects, particularly in solar and wind sectors, is further accelerating market growth. Low voltage capacitors are instrumental in maintaining grid stability, especially in systems experiencing power supply fluctuations. Moreover, the rapid expansion of residential, commercial, and industrial infrastructure in emerging economies fuels the adoption of capacitors in applications like HVAC systems, motor drives, and advanced lighting solutions. This increasing reliance on capacitors underscores their role in modern energy and automation frameworks, as they help meet rising energy demands while adhering to efficiency standards.
| Market Scope | |
|---|---|
| Start Year | 2024 |
| Forecast Year | 2025-2034 |
| Start Value | $9.2 Billion |
| Forecast Value | $20.3 Billion |
| CAGR | 8.4% |
The ceramic low voltage electric capacitor segment is poised for remarkable growth, with forecasts suggesting it will generate USD 7.2 billion by 2034. Renowned for their reliability, compactness, and cost-effectiveness, ceramic capacitors have become a staple in high-frequency and high-temperature applications. The growing trend of miniaturizing electronic devices has amplified the demand for multilayer ceramic capacitors (MLCCs), as these components support high-density circuitry. Innovations in dielectric materials and refined production techniques continue to shape the future of ceramic capacitors, aligning with the evolving needs of modern electronics and high-performance devices.
In terms of end-use applications, the consumer electronics segment is projected to grow at a CAGR of 8.2% through 2034. The increasing use of capacitors in smartphones, portable computing devices, and automotive applications is a significant growth driver. As electronic devices become more complex, capacitors play an essential role in energy storage, noise filtering, and signal decoupling. Leading manufacturers are actively expanding their product portfolios, introducing advanced capacitor solutions to cater to the diverse requirements of consumer electronics and other industries.
The United States low voltage electric capacitor market is anticipated to reach USD 3 billion by 2034. This growth is attributed to rising investments in renewable energy projects, energy-efficient infrastructure, and industrial automation. The widespread adoption of smart grid technologies and the expansion of electric vehicle (EV) charging networks are key contributors. Capacitors remain indispensable for power factor correction and stable energy distribution, making them integral to various sectors, including manufacturing, HVAC systems, and consumer electronics. Stricter energy efficiency regulations and growing industry demand further bolster the market's expansion, solidifying its position in the evolving energy landscape.
Table of Contents
Chapter 1 Methodology & Scope
- 1.1 Market scope & definitions
- 1.2 Market estimates & forecast parameters
- 1.3 Forecast calculation
- 1.4 Data sources
- 1.4.1 Primary
- 1.4.2 Secondary
- 1.4.2.1 Paid
- 1.4.2.2 Public
Chapter 2 Executive Summary
- 2.1 Industry synopsis, 2021 - 2034
Chapter 3 Industry Insights
- 3.1 Industry ecosystem analysis
- 3.2 Regulatory landscape
- 3.3 Industry impact forces
- 3.3.1 Growth drivers
- 3.3.2 Industry pitfalls & challenges
- 3.4 Growth potential analysis
- 3.5 Porter's analysis
- 3.5.1 Bargaining power of suppliers
- 3.5.2 Bargaining power of buyers
- 3.5.3 Threat of new entrants
- 3.5.4 Threat of substitutes
- 3.6 PESTEL analysis
Chapter 4 Competitive Landscape, 2024
- 4.1 Introduction
- 4.2 Strategic outlook
- 4.3 Innovation & sustainability landscape
Chapter 5 Market Size and Forecast, By Material, 2021 – 2034 ('000 Units, USD Billion)
- 5.1 Key trends
- 5.2 Film capacitors
- 5.3 Ceramic capacitors
- 5.4 Electrolytic capacitors
- 5.5 Others
Chapter 6 Market Size and Forecast, By End Use, 2021 – 2034 ('000 Units, USD Billion)
- 6.1 Key trends
- 6.2 Consumer electronics
- 6.3 Automotive
- 6.4 Communications & technology
- 6.5 Transmission & distribution
- 6.6 Others
Chapter 7 Market Size and Forecast, By Region, 2021 – 2034 ('000 Units, USD Billion)
- 7.1 Key trends
- 7.2 North America
- 7.2.1 U.S.
- 7.2.2 Canada
- 7.2.3 Mexico
- 7.3 Europe
- 7.3.1 Germany
- 7.3.2 UK
- 7.3.3 France
- 7.3.4 Austria
- 7.3.5 Italy
- 7.4 Asia Pacific
- 7.4.1 China
- 7.4.2 India
- 7.4.3 Japan
- 7.4.4 South Korea
- 7.4.5 Australia
- 7.5 Middle East & Africa
- 7.5.1 Saudi Arabia
- 7.5.2 UAE
- 7.5.3 South Africa
- 7.6 Latin America
- 7.6.1 Brazil
- 7.6.2 Argentina
- 7.6.3 Chile
Chapter 8 Company Profiles
- 8.1 ABB
- 8.2 Cornell Dubilier
- 8.3 Elna
- 8.4 Havells India
- 8.5 Kemet
- 8.6 Kyocera AVX Components
- 8.7 Murata Manufacturing
- 8.8 Panasonic
- 8.9 Samsung Electro-Mechanics
- 8.10 Schneider Electric
- 8.11 Siemens
- 8.12 Taiyo Yuden
- 8.13 TDK
- 8.14 Vishay Intertechnology
- 8.15 Wima
- 8.16 Xuansn Capacitor

