
PUBLISHER: Global Market Insights Inc. | PRODUCT CODE: 1685147

PUBLISHER: Global Market Insights Inc. | PRODUCT CODE: 1685147
E-commerce Packaging Market Opportunity, Growth Drivers, Industry Trend Analysis, and Forecast 2025 - 2034
The Global E-Commerce Packaging Market, valued at USD 76.3 billion in 2024, is projected to experience robust growth, with an impressive CAGR of 13.2% from 2025 to 2034. This dynamic growth is driven by the ongoing shift towards a circular economy, where sustainability is becoming a key priority for both businesses and consumers. As the awareness of the environmental impact of packaging grows, there is an increasing demand for eco-friendly alternatives. E-commerce brands are under pressure to minimize waste and adopt sustainable practices in response to stricter regulations, growing consumer preferences, and the evolving landscape of environmental responsibility. The packaging industry, with its focus on sustainability and eco-conscious materials, is central to achieving these objectives, offering innovative solutions that align with the demands for reducing carbon footprints and promoting recyclable materials.
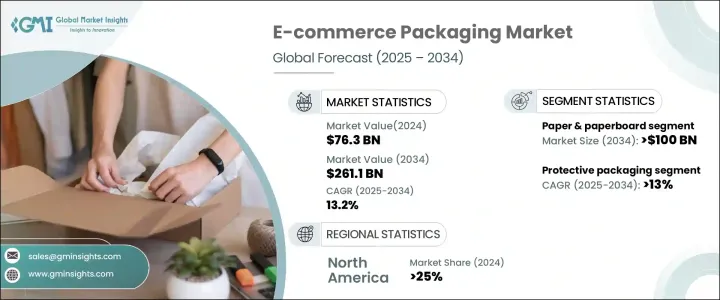
In terms of materials, the e-commerce packaging market is segmented into paper & paperboard, plastic, metal, and other materials. Among these, paper & paperboard are expected to dominate, with a projected market value of USD 100 billion by 2034. This material's popularity is largely due to its eco-friendly attributes, including biodegradability, recyclability, and reusability. With businesses responding to global pressures to limit the use of single-use plastics and meeting environmental compliance standards such as extended producer responsibility (EPR), paper-based packaging is gaining significant traction. The rise in consumer demand for sustainable products also fuels this shift, encouraging brands to prioritize environmentally friendly packaging options that align with corporate sustainability goals.
| Market Scope | |
|---|---|
| Start Year | 2024 |
| Forecast Year | 2025-2034 |
| Start Value | $76.3 Billion |
| Forecast Value | $261.1 Billion |
| CAGR | 13.2% |
When it comes to packaging types, the market includes corrugated boxes, polybags & mailers, protective packaging, labels & tapes, and other solutions. The protective packaging segment is forecast to record the fastest growth, with a CAGR of 13% from 2025 to 2034. The rapid expansion of the e-commerce industry has heightened the need for protective solutions that ensure safe transit of goods, particularly fragile or high-value items. Solutions such as foam inserts, bubble wrap, and air pillows are critical for preventing product damage during shipping. As consumers expect more reliable and secure deliveries, the demand for protective packaging continues to surge, making it a crucial component in the overall growth of the packaging market.
In North America, the e-commerce packaging market held a 25% share in 2024. The region's expanding e-commerce sector, accelerated by recent global events, is driving the demand for more efficient and customized packaging solutions. The need for cost-effective, high-quality packaging is being met with innovations such as on-demand printing and smart packaging technologies. These advancements not only enhance operational efficiency but also offer personalized consumer experiences, positioning North America as a leading player in the global e-commerce packaging market.
Table of Contents
Chapter 1 Methodology & Scope
- 1.1 Market scope & definitions
- 1.2 Base estimates & calculations
- 1.3 Forecast calculations
- 1.4 Data sources
- 1.4.1 Primary
- 1.4.2 Secondary
- 1.4.2.1 Paid sources
- 1.4.2.2 Public sources
Chapter 2 Executive Summary
- 2.1 Industry synopsis, 2022-2034
Chapter 3 Industry Insights
- 3.1 Industry ecosystem analysis
- 3.1.1 Factor affecting the value chain
- 3.1.2 Profit margin analysis
- 3.1.3 Disruptions
- 3.1.4 Future outlook
- 3.1.5 Manufacturers
- 3.1.6 Distributors
- 3.2 Key news & initiatives
- 3.3 Regulatory landscape
- 3.4 Impact forces
- 3.4.1 Growth drivers
- 3.4.1.1 Rising demand for eco-friendly packaging solutions
- 3.4.1.2 Circular economy trend in packaging
- 3.4.1.3 Tighter environmental regulations and policies
- 3.4.1.4 Consumer preference for sustainable brands
- 3.4.1.5 Technological advancements in packaging solutions
- 3.4.2 Industry pitfalls & challenges
- 3.4.2.1 High cost of sustainable packaging solutions
- 3.4.2.2 Complex logistics for reusable packaging
- 3.4.1 Growth drivers
- 3.5 Growth potential analysis
- 3.6 Porter’s analysis
- 3.7 PESTEL analysis
Chapter 4 Competitive Landscape, 2024
- 4.1 Introduction
- 4.2 Company market share analysis
- 4.3 Competitive positioning matrix
- 4.4 Strategic outlook matrix
Chapter 5 Market Estimates & Forecast, By Packaging Type, 2021-2034 (USD Billion & Kilo Tons)
- 5.1 Key trends
- 5.2 Corrugated boxes
- 5.3 Polybags & mailers
- 5.4 Protective packaging
- 5.5 Labels & tapes
- 5.6 Others
Chapter 6 Market Estimates & Forecast, By Material Type, 2021-2034 (USD Billion & Kilo Tons)
- 6.1 Key trends
- 6.2 Paper & paperboard
- 6.3 Plastic
- 6.4 Metal
- 6.5 Others
Chapter 7 Market Estimates & Forecast, By Application, 2021-2034 (USD Billion & Kilo Tons)
- 7.1 Key trends
- 7.2 B2B
- 7.3 B2C
Chapter 8 Market Estimates & Forecast, By End Use Industry, 2021-2034 (USD Billion & Kilo Tons)
- 8.1 Key trends
- 8.2 Electronics & appliances
- 8.3 Apparel & accessories
- 8.4 Beauty & personal care
- 8.5 Home & kitchen
- 8.6 Food & beverages
- 8.7 Healthcare & pharmaceuticals
- 8.8 Others
Chapter 9 Market Estimates & Forecast, By Region, 2021-2034 (USD Billion & Kilo Tons)
- 9.1 Key trends
- 9.2 North America
- 9.2.1 U.S.
- 9.2.2 Canada
- 9.3 Europe
- 9.3.1 UK
- 9.3.2 Germany
- 9.3.3 France
- 9.3.4 Italy
- 9.3.5 Spain
- 9.3.6 Russia
- 9.4 Asia Pacific
- 9.4.1 China
- 9.4.2 India
- 9.4.3 Japan
- 9.4.4 South Korea
- 9.4.5 Australia
- 9.5 Latin America
- 9.5.1 Brazil
- 9.5.2 Mexico
- 9.6 MEA
- 9.6.1 South Africa
- 9.6.2 Saudi Arabia
- 9.6.3 UAE
Chapter 10 Company Profiles
- 10.1 Amcor
- 10.2 Berry Global
- 10.3 Coveris
- 10.4 DCG Tech
- 10.5 Dow
- 10.6 DS Smith
- 10.7 Georgia-Pacific
- 10.8 Mondi
- 10.9 Noissue
- 10.10 Novolex
- 10.11 PolyExpert
- 10.12 ProAmpac
- 10.13 Sealed Air
- 10.14 Smurfit Kappa
- 10.15 Stora Enso
- 10.16 TC Transcontinental
- 10.17 Thimm Group
- 10.18 WestRock

