
PUBLISHER: Global Market Insights Inc. | PRODUCT CODE: 1666588

PUBLISHER: Global Market Insights Inc. | PRODUCT CODE: 1666588
AMI Meter Market Opportunity, Growth Drivers, Industry Trend Analysis, and Forecast 2025 - 2034
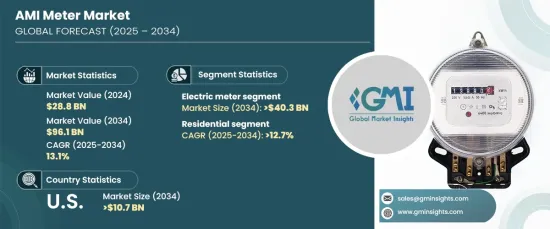
The Global AMI Meter Market reached USD 28.8 billion in 2024 and is poised for remarkable growth, with a projected CAGR of 13.1% between 2025 and 2034. This growth is driven by the increasing emphasis on energy efficiency, the modernization of smart grid systems, and advanced utility management practices. Governments worldwide are implementing robust policies and regulatory frameworks to promote energy conservation, resulting in significant investments in smart grid infrastructure. AMI meters enable real-time data collection, remote monitoring, and two-way communication, ensuring accurate billing, effective demand-side management, and seamless integration of renewable energy sources into existing grids.
As the global energy landscape evolves, AMI meters are becoming essential for utilities to address the growing demand for sustainable solutions. These devices are pivotal in reducing energy waste, optimizing grid performance, and enhancing consumer engagement. The integration of cutting-edge technologies like IoT, AI, and data analytics is revolutionizing the market, allowing predictive maintenance, precise load forecasting, and advanced energy distribution strategies. Moreover, the global push toward meeting carbon reduction targets and enhancing the efficiency of renewable energy resources is expanding the adoption of AMI systems, making them indispensable in the transition to a greener future.
| Market Scope | |
|---|---|
| Start Year | 2024 |
| Forecast Year | 2025-2034 |
| Start Value | $28.8 Billion |
| Forecast Value | $96.1 Billion |
| CAGR | 13.1% |
The electric meter segment is anticipated to generate USD 40.3 billion by 2034, driven by the increasing need for real-time electricity consumption monitoring. These meters empower users to optimize energy usage and reduce costs, creating substantial appeal among residential consumers focused on managing utility expenses effectively. The adoption of smart meters is further accelerated by government initiatives that offer incentives, subsidies, and mandates to promote energy efficiency. This surge in adoption highlights the growing recognition of smart meters as a cost-effective solution for achieving long-term energy savings.
Residential applications are projected to expand at a CAGR of 12.7% through 2034. Governments and utilities are increasingly encouraging the adoption of advanced metering technologies in residential areas to enhance resource efficiency, align with sustainability objectives, and promote better resource management. These technologies support environmentally conscious energy consumption patterns while offering consumers precise control over their utility usage.
The U.S. AMI meter market is forecast to reach USD 10.7 billion by 2034, driven by the growing need for precise monitoring of utility usage in residential applications. Consumers are adopting smart meters to identify inefficiencies, reduce waste, and conserve resources. Regulatory mandates and government incentives are key drivers in this sector, while local utilities are actively promoting smart meter adoption to meet national energy efficiency goals. These efforts are fueling the rapid growth of the AMI meters market across the United States.
Table of Contents
Chapter 1 Methodology & Scope
- 1.1 Market definitions
- 1.2 Base estimates & calculations
- 1.3 Forecast calculation
- 1.4 Data sources
- 1.4.1 Primary
- 1.4.2 Secondary
- 1.4.2.1 Paid
- 1.4.2.2 Public
Chapter 2 Executive Summary
- 2.1 Industry synopsis, 2021 - 2034
Chapter 3 Industry Insights
- 3.1 Industry ecosystem analysis
- 3.2 Regulatory landscape
- 3.3 Industry impact forces
- 3.3.1 Growth drivers
- 3.3.2 Industry pitfalls & challenges
- 3.4 Growth potential analysis
- 3.5 Porter's analysis
- 3.5.1 Bargaining power of suppliers
- 3.5.2 Bargaining power of buyers
- 3.5.3 Threat of new entrants
- 3.5.4 Threat of substitutes
- 3.6 PESTEL analysis
Chapter 4 Competitive landscape, 2024
- 4.1 Strategic dashboard
- 4.2 Innovation & sustainability landscape
Chapter 5 Market Size and Forecast, By Product, 2021 – 2034 (USD Million, ‘000 Units)
- 5.1 Key trends
- 5.2 Electric
- 5.3 Water
- 5.4 Gas
Chapter 6 Market Size and Forecast, By Application, 2021 – 2034 (USD Million, ‘000 Units)
- 6.1 Key trends
- 6.2 Residential
- 6.3 Commercial
- 6.4 Utility
Chapter 7 Market Size and Forecast, By Region, 2021 – 2034 (USD Million, ‘000 Units)
- 7.1 Key trends
- 7.2 North America
- 7.2.1 U.S.
- 7.2.2 Canada
- 7.2.3 Mexico
- 7.3 Europe
- 7.3.1 UK
- 7.3.2 France
- 7.3.3 Germany
- 7.3.4 Italy
- 7.3.5 Russia
- 7.3.6 Spain
- 7.4 Asia Pacific
- 7.4.1 China
- 7.4.2 Australia
- 7.4.3 India
- 7.4.4 Japan
- 7.4.5 South Korea
- 7.5 Middle East & Africa
- 7.5.1 Saudi Arabia
- 7.5.2 UAE
- 7.5.3 Turkey
- 7.5.4 South Africa
- 7.5.5 Egypt
- 7.6 Latin America
- 7.6.1 Brazil
- 7.6.2 Argentina
Chapter 8 Company Profiles
- 8.1 Aclara Technologies
- 8.2 Apator
- 8.3 Arad Group
- 8.4 Badger Meter
- 8.5 BMETERS
- 8.6 Diehl Stiftung
- 8.7 Honeywell International
- 8.8 Itron
- 8.9 Kamstrup
- 8.10 Landis+Gyr
- 8.11 Neptune Technology Group
- 8.12 Ningbo Water Meter
- 8.13 Schneider Electric
- 8.14 Sensus
- 8.15 Siemens
- 8.16 Sontex
- 8.17 Zenner International

