
PUBLISHER: Global Market Insights Inc. | PRODUCT CODE: 1797843

PUBLISHER: Global Market Insights Inc. | PRODUCT CODE: 1797843
Hydraulic Cylinder Market Opportunity, Growth Drivers, Industry Trend Analysis, and Forecast 2025 - 2034
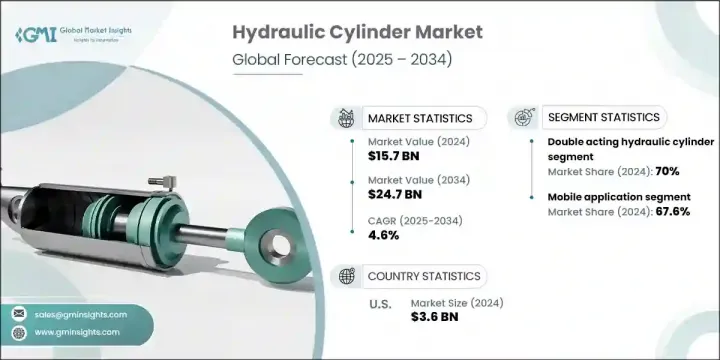
The Global Hydraulic Cylinder Market was valued at USD 15.7 billion in 2024 and is estimated to grow at a CAGR of 4.6% to reach USD 24.7 billion by 2034. Rising integration of industrial automation across multiple end-use sectors-such as agriculture, mining, manufacturing, and construction-is significantly increasing the demand for hydraulic cylinders. As industries continue to push for higher productivity and operational efficiency, there's a growing reliance on reliable motion control systems. This demand is further fueled by ongoing advancements in hydraulic design and technology. Manufacturers are incorporating smart sensors and IoT-based control systems to enhance energy efficiency, system precision, and longevity, thus broadening the technology's market scope. Global agricultural mechanization is gaining traction as producers adopt automated equipment to meet rising food requirements. Precision farming and digitally controlled field operations are becoming mainstream, prompting the need for advanced hydraulic systems across modern agricultural machinery.
The evolving nature of global farming practices is expected to reinforce long-term demand for these components. As agriculture continues transitioning toward automation and precision-based operations, modern equipment such as harvesters, sprayers, and tractors increasingly relies on advanced hydraulic cylinders for efficient and controlled movement. The shift toward data-driven farming, GPS-guided systems, and variable rate technology demands highly responsive hydraulic mechanisms capable of delivering consistent performance under diverse field conditions. Additionally, government initiatives promoting smart agriculture, coupled with the global push to boost food production sustainably, are encouraging the adoption of machinery equipped with intelligent hydraulic systems.
| Market Scope | |
|---|---|
| Start Year | 2024 |
| Forecast Year | 2025-2034 |
| Start Value | $15.7 Billion |
| Forecast Value | $24.7 Billion |
| CAGR | 4.6% |
In 2024, the double-acting hydraulic cylinders segment held a 70% share and will grow at a CAGR of 4% through 2034. These cylinders are critical in automation-heavy applications such as robotics, large-scale manufacturing, and high-load construction machinery. Their ability to support bidirectional motion with improved control makes them ideal for smart systems. With industries prioritizing predictive maintenance and real-time data analytics, demand is rising for cylinders equipped with embedded sensors and feedback mechanisms, enabling responsive force management and enhanced load precision.
The mobile equipment segment held a 67.6% share in 2024 and is projected to grow at a CAGR of 4.2% by 2034. This segment includes hydraulic systems used in agricultural equipment, off-highway vehicles, and mining machinery. As equipment evolves to meet stricter efficiency and emissions standards, mobile hydraulic cylinders are being reengineered to integrate hybrid drive technology and intelligent control platforms. The adoption of real-time telemetry, remote diagnostics, and terrain-responsive adjustments is further elevating their role in modern equipment performance.
United States Hydraulic Cylinder Market held a 30% share and generated USD 3.6 billion in 2024. Growth in the region is being supported by increased investments in infrastructure, including transportation and utility development. Ongoing expansion in the agriculture and construction machinery segments is reinforcing product demand. The region's renewed focus on reshoring manufacturing, particularly within the aerospace and automotive sectors, is encouraging the deployment of energy-efficient hydraulic technologies. Additionally, widespread implementation of digital and connected hydraulic systems is advancing innovation and driving equipment upgrades across industries.
The leading Hydraulic Cylinder Market players include Norrhydro Oy, Caterpillar, Bosch Rexroth, Parker Hannifin Group, and Eaton Corporation. Major players in the hydraulic cylinder market are leveraging a mix of product innovation and digital integration to secure a competitive advantage. Companies are actively developing smart hydraulic solutions that incorporate telematics, condition monitoring, and predictive maintenance to deliver better system performance. There is a strong push toward localization of production to ensure faster lead times and meet regional regulatory standards.
Table of Contents
Chapter 1 Methodology & Scope
- 1.1 Market scope & definitions
- 1.2 Market estimates & forecast parameters
- 1.3 Forecast calculation
- 1.4 Data sources
- 1.4.1 Primary
- 1.4.2 Secondary
- 1.4.2.1 Paid
- 1.4.2.2 Public
Chapter 2 Executive Summary
- 2.1 Industry synopsis, 2021 - 2034
- 2.1.1 Business trends
- 2.1.2 Function trends
- 2.1.3 Product trends
- 2.1.4 Application trends
- 2.1.5 Regional trends
Chapter 3 Industry Insights
- 3.1 Industry ecosystem analysis
- 3.2 Technology trend
- 3.2.1 Integration of smart sensors & IoT connectivity
- 3.2.2 Digital hydraulic actuation systems
- 3.2.3 Electro-hydraulic integration
- 3.3 Price trend analysis (USD/unit)
- 3.3.1 By product
- 3.3.2 By region
- 3.4 Regulatory landscape
- 3.5 Industry impact forces
- 3.6 Growth potential analysis
- 3.7 Porter's analysis
- 3.7.1 Bargaining power of suppliers
- 3.7.2 Bargaining power of buyers
- 3.7.3 Threat of new entrants
- 3.7.4 Threat of substitutes
- 3.8 PESTEL analysis
- 3.8.1 Political factors
- 3.8.2 Economic factors
- 3.8.3 Social factors
- 3.8.4 Technological factors
- 3.8.5 Environmental factors
- 3.8.6 Legal factors
- 3.9 Emerging opportunities & trends
- 3.9.1 Digitalization & IoT integration
- 3.9.2 Emerging market penetration
Chapter 4 Competitive landscape, 2025
- 4.1 Introduction
- 4.2 Company market share analysis by region, 2024
- 4.2.1 North America
- 4.2.2 Europe
- 4.2.3 Asia Pacific
- 4.2.4 Middle East & Africa
- 4.2.5 Latin America
- 4.3 Strategic initiative
- 4.4 Competitive benchmarking
- 4.5 Strategic dashboard
- 4.6 Innovation & technology landscape
Chapter 5 Market Size and Forecast, By Function, 2021 - 2034 (USD Billion, Million Units)
- 5.1 Key trends
- 5.2 Single acting cylinders
- 5.3 Double acting cylinders
Chapter 6 Market Size and Forecast, By Product, 2021 - 2034 (USD Billion, Million Units)
- 6.1 Key trends
- 6.2 Tie-rod cylinder
- 6.3 Welded cylinder
- 6.4 Others
Chapter 7 Market Size and Forecast, By Application, 2021 - 2034 (USD Billion, Million Units)
- 7.1 Key trends
- 7.2 Mobile
- 7.3 Industrial
Chapter 8 Market Size and Forecast, By Region, 2021 - 2034 (USD Billion, Million Units)
- 8.1 Key trends
- 8.2 North America
- 8.2.1 U.S.
- 8.2.2 Canada
- 8.3 Europe
- 8.3.1 Germany
- 8.3.2 UK
- 8.3.3 Italy
- 8.3.4 Spain
- 8.3.5 France
- 8.4 Asia Pacific
- 8.4.1 China
- 8.4.2 India
- 8.4.3 Japan
- 8.4.4 Australia
- 8.4.5 South Korea
- 8.5 Middle East & Africa
- 8.5.1 Saudi Arabia
- 8.5.2 UAE
- 8.5.3 South Africa
- 8.6 Latin America
- 8.6.1 Brazil
- 8.6.2 Argentina
Chapter 9 Company Profiles
- 9.1 Aggressive, Inc.
- 9.2 Best Metal Products
- 9.3 Bosch Rexroth
- 9.4 Caterpillar
- 9.5 Eaton Corporation
- 9.6 ENERPAC
- 9.7 Hydrosila
- 9.8 Hydac
- 9.9 JARP Industries Inc.
- 9.10 KYB Corporation
- 9.11 Liebherr
- 9.12 Ligon Industries, LLC
- 9.13 Montanhydraulik GmbH
- 9.14 Norrhydro Oy
- 9.15 Pacoma GmbH
- 9.16 PARKER HANNIFIN CORP
- 9.17 Prince Manufacturing Corporation
- 9.18 Texas Inc
- 9.19 Weber-Hydraulik Group
- 9.20 Wipro Infrastructure Engineering.

