
PUBLISHER: Global Market Insights Inc. | PRODUCT CODE: 1666905

PUBLISHER: Global Market Insights Inc. | PRODUCT CODE: 1666905
Asia Pacific Smart Water Metering Market Opportunity, Growth Drivers, Industry Trend Analysis, and Forecast 2025 - 2034
Asia Pacific Smart Water Metering Market reached USD 510.9 million in 2024 and is projected to expand at a robust CAGR of 30.4% from 2025 to 2034. This rapid expansion is fueled by a combination of factors, including growing urbanization, increasing water scarcity, and the critical need for efficient water resource management. As the region's population swells, governments are increasingly adopting advanced metering technologies to better allocate water, reduce waste, and improve the accuracy of billing systems. Furthermore, the rise of smart city projects and the growing emphasis on sustainability are major drivers behind the heightened demand for automated water monitoring solutions. The integration of smart technologies enables utilities to collect real-time data, optimize consumption, and provide consumers with insights to conserve water. As environmental concerns continue to rise, both governments and individuals are prioritizing water efficiency to ensure sustainable management of this vital resource.
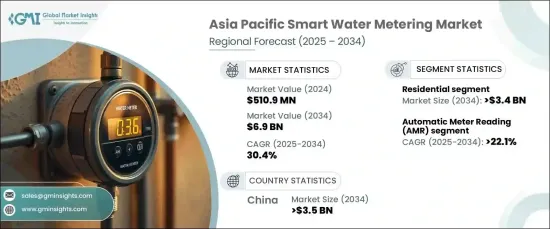
The residential segment within the smart water metering market is expected to see substantial growth, generating USD 3.4 billion by 2034. This growth is attributed to a surge in consumer awareness surrounding water conservation and sustainability. More households are embracing smart water meters that allow them to track their water usage in real-time, enabling them to make more informed decisions about consumption. The integration of these meters with other smart home technologies is also contributing to their widespread adoption. Homeowners are increasingly turning to connected solutions for enhanced energy efficiency and overall cost savings. The demand for such products is expected to accelerate as more consumers seek to reduce their environmental footprint and gain greater control over their resource usage.
| Market Scope | |
|---|---|
| Start Year | 2024 |
| Forecast Year | 2025-2034 |
| Start Value | $510.9 Million |
| Forecast Value | $6.9 Billion |
| CAGR | 30.4% |
In terms of technology, the Automatic Meter Reading (AMR) segment is projected to experience steady growth, with a CAGR of 22.1% through 2034. This technology enables utilities to remotely collect data from meters without the need for manual intervention, significantly reducing labor costs and human error. AMR systems are particularly advantageous in densely populated areas, where manual meter reading is not only labor-intensive but also inefficient. With utilities striving for greater operational efficiency and cost-effectiveness, AMR technology is becoming increasingly essential.
China smart water metering market, in particular, is poised for rapid expansion and is expected to generate USD 3.5 billion by 2034. The country's strong focus on water conservation, infrastructure modernization, and the development of smart cities has led to an accelerated adoption of advanced metering technologies. Addressing the challenges of water scarcity and inefficient resource management, China has implemented a variety of government initiatives to promote smart water metering solutions. Policies under the "Made in China 2025" strategy and ongoing urbanization efforts are expected to further drive the adoption of these systems across the country.
Table of Contents
Chapter 1 Methodology & Scope
- 1.1 Market definitions
- 1.2 Base estimates & calculations
- 1.3 Forecast calculation
- 1.4 Data sources
- 1.4.1 Primary
- 1.4.2 Secondary
- 1.4.2.1 Paid
- 1.4.2.2 Public
Chapter 2 Industry Insights
- 2.1 Industry ecosystem analysis
- 2.2 Regulatory landscape
- 2.3 Industry impact forces
- 2.3.1 Growth drivers
- 2.3.2 Industry pitfalls & challenges
- 2.4 Growth potential analysis
- 2.5 Porter's analysis
- 2.5.1 Bargaining power of suppliers
- 2.5.2 Bargaining power of buyers
- 2.5.3 Threat of new entrants
- 2.5.4 Threat of substitutes
- 2.6 PESTEL analysis
Chapter 3 Competitive landscape, 2024
- 3.1 Strategic dashboard
- 3.2 Innovation & sustainability landscape
Chapter 4 Market Size and Forecast, By Application, 2021 – 2034 (USD Million, ‘000 Units)
- 4.1 Key trends
- 4.2 Residential
- 4.3 Commercial
- 4.4 Utility
Chapter 5 Market Size and Forecast, By Technology, 2021 – 2034 (USD Million, ‘000 Units)
- 5.1 Key trends
- 5.2 AMI
- 5.3 AMR
Chapter 6 Market Size and Forecast, By Product, 2021 – 2034 (USD Million, ‘000 Units)
- 6.1 Key trends
- 6.2 Hot water meter
- 6.3 Cold water meter
Chapter 7 Market Size and Forecast, By Country, 2021 – 2034 (USD Million, ‘000 Units)
- 7.1 Key trends
- 7.2 China
- 7.3 Australia
- 7.4 India
- 7.5 Japan
- 7.6 South Korea
Chapter 8 Company Profiles
- 8.1 Aclara Technologies
- 8.2 Apator
- 8.3 Arad Group
- 8.4 Badger Meter
- 8.5 BMETERS
- 8.6 Diehl Stiftung
- 8.7 Honeywell International
- 8.8 Itron
- 8.9 Kamstrup
- 8.10 Landis+Gyr
- 8.11 Neptune Technology Group
- 8.12 Ningbo Water Meter
- 8.13 Schneider Electric
- 8.14 Sensus
- 8.15 Siemens
- 8.16 Sontex
- 8.17 Zenner International

