
PUBLISHER: Global Market Insights Inc. | PRODUCT CODE: 1716539

PUBLISHER: Global Market Insights Inc. | PRODUCT CODE: 1716539
Direct Reduced Iron Market Opportunity, Growth Drivers, Industry Trend Analysis, and Forecast 2025 - 2034
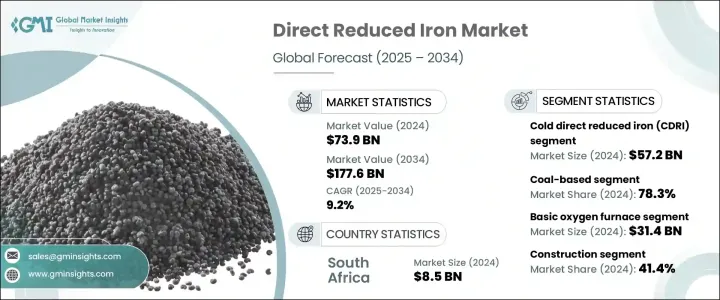
The Global Direct Reduced Iron Market was valued at USD 73.9 billion in 2024 and is projected to expand at a robust CAGR of 9.2% from 2025 to 2034. As industries such as construction, automotive, and manufacturing intensify their focus on sustainable production methods, the demand for DRI continues to gain momentum. This high-quality metallic product, derived from iron ore, is revolutionizing the iron and steel industry by offering a cleaner, more energy-efficient alternative to traditional iron ore-based production. With a growing shift toward environmentally responsible steelmaking, DRI is becoming a key substitute for conventional ironmaking processes, reducing carbon emissions and optimizing energy consumption.
The DRI industry is undergoing rapid transformation, driven by technological advancements and increasing global emphasis on sustainability. One of the primary growth catalysts is the adoption of hydrogen-based and natural gas-based reduction processes, which significantly cut down CO2 emissions compared to coal-based methods. Steel manufacturers are increasingly integrating DRI into electric arc furnaces (EAFs) to reduce reliance on scrap steel and enhance product consistency. Furthermore, the adoption of hot briquetted iron (HBI), a more compact and transport-friendly version of DRI, is streamlining logistics and expanding market reach. As global regulatory frameworks tighten carbon emission norms, steel producers are accelerating their transition toward cleaner alternatives, positioning DRI as a vital component in the future of sustainable steel manufacturing.
| Market Scope | |
|---|---|
| Start Year | 2024 |
| Forecast Year | 2025-2034 |
| Start Value | $73.9 Billion |
| Forecast Value | $177.6 Billion |
| CAGR | 9.2% |
The cold direct reduced iron (CDRI) market generated USD 57.2 billion in 2024. CDRI is a preferred choice for high-quality steel production, particularly in electric arc furnaces, where it seamlessly integrates with steelmaking processes. Its superior purity and reduced impurities make it an ideal raw material for premium steel grades used in infrastructure, heavy machinery, and automotive applications. With stringent environmental regulations pushing industries toward lower-emission solutions, CDRI continues to gain traction as an eco-friendly alternative to traditional ironmaking.
In terms of production technology, the coal-based segment accounted for a dominant 78.3% share in 2024. Despite the growing emphasis on cleaner alternatives, coal-based DRI production remains the most cost-efficient and widely adopted technique, especially in regions abundant in coal resources. The process enables large-scale production at relatively low operational costs, making it an attractive option in rapidly industrializing economies. Steel manufacturers continue to rely on this method to meet increasing demand while balancing economic feasibility, ensuring the segment's continued market dominance.
The South Africa direct reduced iron market generated USD 8.5 billion in 2024. As global industries intensify their commitment to reducing carbon footprints, regions such as South Africa are witnessing a surge in DRI adoption. Government policies aimed at improving energy efficiency and promoting carbon neutrality are driving steel producers to invest in sustainable technologies. With a strong focus on green manufacturing, the region is positioning itself as a key player in the transition toward eco-friendly steel production.
Table of Contents
Chapter 1 Methodology & Scope
- 1.1 Market scope & definition
- 1.2 Base estimates & calculations
- 1.3 Forecast calculation
- 1.4 Data sources
- 1.4.1 Primary
- 1.4.2 Secondary
- 1.4.2.1 Paid sources
- 1.4.2.2 Public sources
Chapter 2 Executive Summary
- 2.1 Industry synopsis, 2021-2034
Chapter 3 Industry Insights
- 3.1 Industry ecosystem analysis
- 3.1.1 Factor affecting the value chain
- 3.1.2 Profit margin analysis
- 3.1.3 Disruptions
- 3.1.4 Future outlook
- 3.1.5 Manufacturers
- 3.1.6 Distributors
- 3.2 Supplier landscape
- 3.3 Profit margin analysis
- 3.4 Key news & initiatives
- 3.5 Regulatory landscape
- 3.6 Impact forces
- 3.6.1 Growth drivers
- 3.6.1.1 Adoption of sustainable and energy-efficient steel production methods
- 3.6.1.2 Technological advancements in DRI production processes
- 3.6.1.3 Rising steel demand in developing economies
- 3.6.2 Industry pitfalls & challenges
- 3.6.2.1 Volatile prices of raw materials like iron ore and natural gas
- 3.6.2.2 High capital investment for DRI production facilities
- 3.6.1 Growth drivers
- 3.7 Growth potential analysis
- 3.8 Porter's analysis
- 3.9 PESTEL analysis
Chapter 4 Competitive Landscape, 2024
- 4.1 Introduction
- 4.2 Company market share analysis
- 4.3 Competitive positioning matrix
- 4.4 Strategic outlook matrix
Chapter 5 Market Estimates and Forecast, By Product Type, 2021 – 2034 (USD Billion) (Kilo Tons)
- 5.1 Key trends
- 5.2 Hot briquetted iron
- 5.3 Cold direct reduced iron
Chapter 6 Market Estimates and Forecast, By Technology, 2021 – 2034 (USD Billion) (Kilo Tons)
- 6.1 Key trends
- 6.2 Gas-based
- 6.3 Coal-based
Chapter 7 Market Estimates and Forecast, By Application, 2021 – 2034 (USD Billion) (Kilo Tons)
- 7.1 Key trends
- 7.2 Electric arc furnace
- 7.3 Basic oxygen furnace
- 7.4 Foundries
- 7.5 Others
Chapter 8 Market Estimates and Forecast, By End Use, 2021 – 2034 (USD Billion) (Kilo Tons)
- 8.1 Key trends
- 8.2 Construction
- 8.3 Automotive
- 8.4 Aerospace
- 8.5 Machinery & equipment
- 8.6 Electrical & electronic
- 8.7 Renewable energy
- 8.8 Others
Chapter 9 Market Estimates and Forecast, By Region, 2021 – 2034 (USD Billion) (Kilo Tons)
- 9.1 Key trends
- 9.2 North America
- 9.2.1 U.S.
- 9.2.2 Canada
- 9.3 Europe
- 9.3.1 Germany
- 9.3.2 UK
- 9.3.3 France
- 9.3.4 Spain
- 9.3.5 Italy
- 9.3.6 Netherlands
- 9.4 Asia Pacific
- 9.4.1 China
- 9.4.2 India
- 9.4.3 Japan
- 9.4.4 Australia
- 9.4.5 South Korea
- 9.5 Latin America
- 9.5.1 Brazil
- 9.5.2 Mexico
- 9.5.3 Argentina
- 9.6 Middle East and Africa
- 9.6.1 Saudi Arabia
- 9.6.2 South Africa
- 9.6.3 UAE
Chapter 10 Company Profiles
- 10.1 ArcelorMittal
- 10.2 Essar
- 10.3 JFE Steel
- 10.4 JSW Steel
- 10.5 Kobe Steel
- 10.6 Metinvest Holding
- 10.7 MIDREX Technologies
- 10.8 Mobarakeh steel
- 10.9 NLMK Group
- 10.10 NUCOR Corporation
- 10.11 Qatar Steel Company
- 10.12 Sinosteel Corporation
- 10.13 Tata Steel
- 10.14 Tenova
- 10.15 Ternium

