
PUBLISHER: Global Market Insights Inc. | PRODUCT CODE: 1684825

PUBLISHER: Global Market Insights Inc. | PRODUCT CODE: 1684825
Asia Pacific Transmission Lines Market Opportunity, Growth Drivers, Industry Trend Analysis, and Forecast 2025 - 2034
Asia Pacific Transmission Lines Market, valued at USD 7.1 billion in 2024, is expected to experience a CAGR of 5.3% from 2025 to 2034. This growth is primarily fueled by the increasing demand for high-voltage transmission systems and the region's commitment to integrating renewable energy into power grids. As the share of electricity generated from renewable sources continues to rise, long-distance transmission becomes crucial for ensuring a steady and reliable power supply to densely populated urban areas. To keep pace with the growing energy needs, governments in the Asia Pacific region are focused on enhancing grid efficiency, reducing transmission losses, and investing in more sustainable energy infrastructure. These efforts are driving the expansion of the transmission lines market, with ongoing developments aiming to optimize power distribution systems, minimize energy wastage, and support the broader shift toward renewable sources.
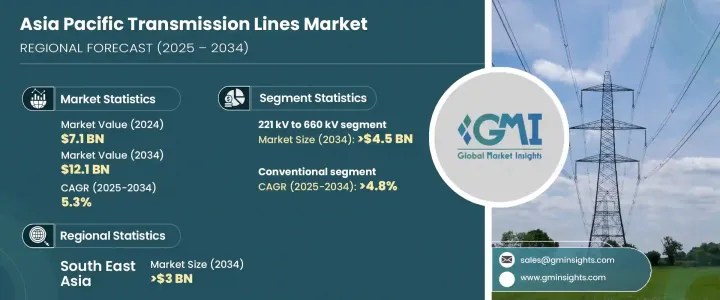
The 221 kV to 660 kV voltage segment is expected to generate USD 4.5 billion by 2034. This surge in demand is largely due to the modernization of existing power transmission networks and the continued focus on incorporating renewable energy into national grids. High-voltage transmission solutions are integral to ensuring that electricity generated from clean sources reaches urban centers effectively, supporting the region's transition toward greener energy. The ongoing upgrades to aging electrical infrastructure, paired with increasing governmental and private sector investments, are key drivers for this market segment's growth.
| Market Scope | |
|---|---|
| Start Year | 2024 |
| Forecast Year | 2025-2034 |
| Start Value | $7.1 Billion |
| Forecast Value | $12.1 Billion |
| CAGR | 5.3% |
In terms of conductor technology, the conventional segment is projected to grow at a steady CAGR of 4.8% through 2034. As electricity consumption rises across the region and grids are modernized, the need for reliable and efficient transmission networks becomes more critical. The adoption of advanced materials, including aluminum composite conductors, along with the implementation of digital monitoring systems, is enhancing the performance and longevity of transmission lines. This shift not only improves the reliability of power distribution but also drives down maintenance costs, making the conventional conductor segment an attractive area for investment.
Southeast Asia is poised to be a significant contributor to the transmission lines market, with a projected market value of USD 3 billion by 2034. Rapid economic development, coupled with increasing urbanization and electricity demand, creates an urgent need for stronger transmission infrastructure. Cross-border energy connectivity initiatives are also playing a pivotal role in expanding the region's power grid, ensuring that electricity is distributed efficiently across borders and to areas that need it the most. The continued development of transmission systems in Southeast Asia is vital for sustaining the region's economic growth and energy security.
Table of Contents
Chapter 1 Methodology & Scope
- 1.1 Market scope & definitions
- 1.2 Market estimates & forecast parameters
- 1.3 Forecast calculation
- 1.4 Data sources
- 1.4.1 Primary
- 1.4.2 Secondary
- 1.4.2.1 Paid
- 1.4.2.2 Public
Chapter 2 Industry Insights
- 2.1 Industry ecosystem analysis
- 2.2 Regulatory landscape
- 2.3 Industry impact forces
- 2.3.1 Growth drivers
- 2.3.2 Industry pitfalls & challenges
- 2.4 Growth potential analysis
- 2.5 Porter's analysis
- 2.5.1 Bargaining power of suppliers
- 2.5.2 Bargaining power of buyers
- 2.5.3 Threat of new entrants
- 2.5.4 Threat of substitutes
- 2.6 PESTEL analysis
Chapter 3 Competitive Landscape, 2024
- 3.1 Introduction
- 3.2 Strategic outlook
- 3.3 Innovation & sustainability landscape
Chapter 4 Market Size and Forecast, By Voltage, 2021 – 2034 (ckm, USD Billion)
- 4.1 Key trends
- 4.2 132 kV to 220 kV
- 4.3 221 kV to 660 kV
- 4.4 > 660 kV
Chapter 5 Market Size and Forecast, By Conductor, 2021 – 2034 (ckm, USD Billion)
- 5.1 Key trends
- 5.2 Conventional
- 5.3 High temperature
- 5.4 Others
Chapter 6 Market Size and Forecast, By Region, 2021 – 2034 (ckm, USD Billion)
- 6.1 Key trends
- 6.2 South East Asia
- 6.3 Central Asia
- 6.4 SAARC
- 6.5 Oceania
Chapter 7 Company Profiles
- 7.1 Bekaert
- 7.2 CMI
- 7.3 CTC Global
- 7.4 Galaxy Transmissions
- 7.5 KEC
- 7.6 LS Cable
- 7.7 Nexans
- 7.8 Prysmian
- 7.9 Siemens
- 7.10 Special Cable
- 7.11 Sterlite Power
- 7.12 Sumitomo Electric
- 7.13 Taihan Cable
- 7.14 Universal Cable

