
PUBLISHER: Global Market Insights Inc. | PRODUCT CODE: 1685055

PUBLISHER: Global Market Insights Inc. | PRODUCT CODE: 1685055
Asia Pacific Distribution Lines Market Opportunity, Growth Drivers, Industry Trend Analysis, and Forecast 2025 - 2034
Asia Pacific Distribution Lines Market, valued at USD 78.2 billion in 2024, is poised for substantial growth, with an expected CAGR of 5.8% from 2025 to 2034. This upward trajectory is largely driven by the rapid urbanization of the region, substantial investments in renewable energy infrastructure, and an escalating demand for electricity. Both governmental bodies and private entities are focusing on modernizing outdated electricity transmission systems, which is critical for improving the reliability and efficiency of power distribution networks to meet the expanding energy needs. The market is also benefiting from significant advancements in grid technology, such as the integration of smart grid systems and the adoption of innovative solutions designed to optimize electricity flow and reduce energy losses. As the region continues to face challenges related to energy security and sustainability, there is a heightened focus on developing advanced distribution lines capable of supporting the integration of renewable energy sources, ensuring a more resilient and eco-friendly energy infrastructure.
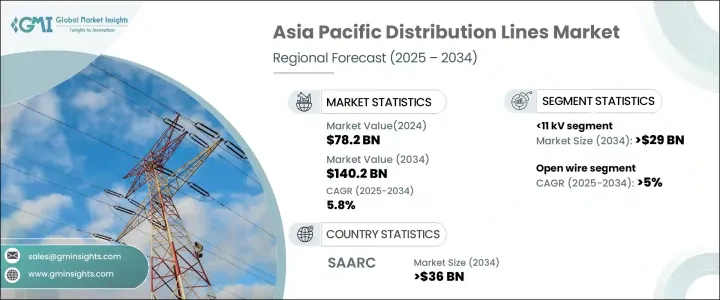
The distribution lines segment with capacities under 11 kV is projected to generate USD 29 billion by 2034. This particular segment is witnessing strong demand in developing economies, driven by the increased adoption of microgrids and the integration of renewable energy solutions. Countries such as China, India, and Indonesia are making significant investments in electrical systems, especially as part of their efforts to electrify rural areas and deploy decentralized energy sources. These initiatives not only provide reliable electricity to underserved regions but also promote cleaner energy alternatives, helping the region transition toward a more sustainable energy landscape.
| Market Scope | |
|---|---|
| Start Year | 2024 |
| Forecast Year | 2025-2034 |
| Start Value | $78.2 Billion |
| Forecast Value | $140.2 Billion |
| CAGR | 5.8% |
Meanwhile, the open wire distribution lines segment is expected to grow at a steady CAGR of 5% through 2034. These lines remain a popular choice for rural and remote areas due to their affordability and ease of deployment. Their scalability makes them ideal for regions with low population densities, especially as these areas continue to expand their electrification efforts. Additionally, the integration of monitoring devices into open wire systems has significantly improved their reliability and operational performance, addressing the increasing demand for electricity in these regions.
The SAARC region's distribution lines market is set to generate USD 36 billion by 2034, bolstered by growing electricity demand and a significant shift toward renewable energy. Regional authorities are prioritizing the installation of modern infrastructure designed to reduce transmission losses and enhance grid reliability. Collaborative cross-border energy initiatives, such as the South Asia Regional Energy initiative, are playing a key role in fostering efficient, interconnected distribution systems, further supporting market growth and sustainability in the region.
Table of Contents
Chapter 1 Methodology & Scope
- 1.1 Market scope & definitions
- 1.2 Market estimates & forecast parameters
- 1.3 Forecast calculation
- 1.4 Data sources
- 1.4.1 Primary
- 1.4.2 Secondary
- 1.4.2.1 Paid
- 1.4.2.2 Public
Chapter 2 Industry Insights
- 2.1 Industry ecosystem analysis
- 2.2 Regulatory landscape
- 2.3 Industry impact forces
- 2.3.1 Growth drivers
- 2.3.2 Industry pitfalls & challenges
- 2.4 Growth potential analysis
- 2.5 Porter's analysis
- 2.5.1 Bargaining power of suppliers
- 2.5.2 Bargaining power of buyers
- 2.5.3 Threat of new entrants
- 2.5.4 Threat of substitutes
- 2.6 PESTEL analysis
Chapter 3 Competitive Landscape, 2024
- 3.1 Introduction
- 3.2 Strategic outlook
- 3.3 Innovation & sustainability landscape
Chapter 4 Market Size and Forecast, By Voltage, 2021 – 2034 (ckm, USD Billion)
- 4.1 Key trends
- 4.2 < 11 kV
- 4.3 11-33 kV
- 4.4 > 33 kV - 66 kV
- 4.5 > 66 kV
Chapter 5 Market Size and Forecast, By Product, 2021 – 2034 (ckm, USD Billion)
- 5.1 Key trends
- 5.2 Open wire
- 5.3 ABC
Chapter 6 Market Size and Forecast, By Region, 2021 – 2034 (ckm, USD Billion)
- 6.1 Key trends
- 6.2 South East Asia
- 6.3 Central Asia
- 6.4 SAARC
- 6.5 Oceania
Chapter 7 Company Profiles
- 7.1 CTC Global
- 7.2 General Cable
- 7.3 Gupta Power
- 7.4 Henan Qingzhou Cable
- 7.5 Hindustan Urban Infrastructure
- 7.6 Kalpataru Power Distribution
- 7.7 KEC International
- 7.8 LS Cable
- 7.9 Nexans
- 7.10 Prysmian Group
- 7.11 Shanghai Shenghua Cable
- 7.12 Sterlite Power
- 7.13 Sumitomo Electric
- 7.14 Taihan Electric Wire

