
PUBLISHER: Global Market Insights Inc. | PRODUCT CODE: 1667133

PUBLISHER: Global Market Insights Inc. | PRODUCT CODE: 1667133
Bridge Inspection and Maintenance Services Market Opportunity, Growth Drivers, Industry Trend Analysis, and Forecast 2025 - 2034
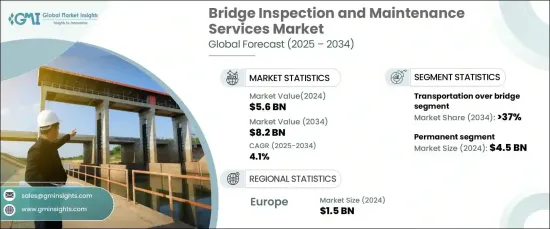
The Global Bridge Inspection And Maintenance Services Market, valued at USD 5.6 billion in 2024, is expected to expand at a CAGR of 4.1% from 2025 to 2034. The market expansion is largely driven by increasing government investments in infrastructure development and maintenance. As the demand for regular bridge inspections intensifies, governments worldwide are prioritizing safety and longevity in critical infrastructure.
This increased investment is essential not only to address aging infrastructure but also to ensure the continued functionality of bridges that are vital for transportation networks. Furthermore, the growing shift towards sustainable practices in construction and maintenance is propelling demand for eco-friendly solutions. Governments and organizations are placing a stronger emphasis on green initiatives, with a focus on reducing the environmental impact of bridge services while enhancing their durability and performance.
| Market Scope | |
|---|---|
| Start Year | 2024 |
| Forecast Year | 2025-2034 |
| Start Value | $5.6 Billion |
| Forecast Value | $8.2 Billion |
| CAGR | 4.1% |
The demand for bridge inspection and maintenance services is fueled by the essential role bridges play in supporting transportation, trade, and daily commuting. Regular upkeep is crucial for ensuring the safety and functionality of these structures, particularly as they age. There is a rising urgency for consistent inspections and maintenance to avoid costly repairs and prolong the life of bridges. In addition to safety, the focus on sustainability in the industry reflects a broader trend towards environmentally conscious infrastructure management. As environmental concerns continue to rise, there is an increasing push to adopt green technologies and materials in bridge maintenance, driving innovation within the sector.
By type, the transportation over bridge segment is expected to capture a dominant 37% share of the market by 2034. This growth is primarily due to the critical importance of transportation bridges, including highways and railways, which facilitate the movement of goods and people. With many of these bridges reaching the end of their service life, routine inspections and maintenance are essential for ensuring they remain structurally sound and continue to support economic activity. The extensive number of transportation bridges, along with their diverse functions, highlights the critical need for regular and efficient upkeep.
In terms of bridge construction, the permanent category achieved a market value of USD 4.5 billion in 2024. Permanent bridge inspection and maintenance solutions are becoming increasingly popular due to their long-term benefits. Government agencies and organizations focused on sustainable infrastructure development favor permanent solutions for their durability and cost-effectiveness. By incorporating advanced technologies, such as sensors and real-time monitoring systems, permanent solutions reduce the frequency of maintenance and extend the lifespan of bridges, making them an attractive choice for long-term infrastructure planning.
Europe stands as a key player in the bridge inspection and maintenance services market, generating USD 1.5 billion in 2024. The region's commitment to sustainability and the integration of innovative inspection technologies have reinforced its position in the global market. With a well-established framework for maintaining an extensive bridge network, Europe has set a benchmark in the industry. Strong public-private partnerships have driven the efficient financing and execution of infrastructure projects, further accelerating the sector's growth.
Table of Contents
Chapter 1 Methodology & Scope
- 1.1 Research design
- 1.1.1 Research approach
- 1.1.2 Data collection methods
- 1.2 Base estimates and calculations
- 1.2.1 Base year calculation
- 1.2.2 Key trends for market estimates
- 1.3 Forecast model
- 1.4 Primary research & validation
- 1.4.1 Primary sources
- 1.4.2 Data mining sources
- 1.5 Market definitions
Chapter 2 Executive Summary
- 2.1 Industry 3600 synopsis, 2021-2034
Chapter 3 Industry Insights
- 3.1 Industry ecosystem analysis
- 3.2 Supplier landscape
- 3.2.1 Raw material suppliers
- 3.2.2 Third-party contractors
- 3.2.3 Equipment providers
- 3.2.4 Engineering firms
- 3.2.5 Technology providers
- 3.2.6 End use
- 3.3 Profit margin analysis
- 3.4 Technology & innovation landscape
- 3.5 Patent analysis
- 3.6 Key news & initiatives
- 3.7 Regulatory landscape
- 3.8 Impact forces
- 3.8.1 Growth drivers
- 3.8.1.1 High presence of aging bridge infrastructure across the globe
- 3.8.1.2 Growing focus of government on bridge maintenance to extend the lifespan of bridges
- 3.8.1.3 Technological advancements in inspection technologies
- 3.8.1.4 Increasing urbanization and population growth
- 3.8.1.5 Rising government funding and investment
- 3.8.2 Industry pitfalls & challenges
- 3.8.3 Lack of skilled workforce in developing countries
- 3.8.4 Lengthy approval process and bureaucratic hurdles
- 3.8.1 Growth drivers
- 3.9 Growth potential analysis
- 3.10 Porter’s analysis
- 3.11 PESTEL analysis
Chapter 4 Competitive Landscape, 2024
- 4.1 Introduction
- 4.2 Company market share analysis
- 4.3 Competitive positioning matrix
- 4.4 Strategic outlook matrix
Chapter 5 Market Estimates & Forecast, By Inspection, 2021-2034 ($Bn)
- 5.1 Key trends
- 5.2 Superficial
- 5.3 Routine
- 5.4 Special
- 5.5 Principal
- 5.6 Damage
Chapter 6 Market Estimate & Forecast, By Inspection Purpose, 2021-2034 ($Bn)
- 6.1 Key trends
- 6.2 Inventory inspection
- 6.3 Condition inspection
- 6.4 Maintenance inspection
- 6.5 Rehabilitation inspection
Chapter 7 Market Estimates & Forecast, By Bridge, 2021-2034 ($Bn)
- 7.1 Key trends
- 7.2 Transportation over bridge
- 7.3 Pedestrian over bridge
- 7.4 Railway over bridge
- 7.5 Pipeline bridge
Chapter 8 Market Estimates & Forecast, By Bridge Construction, 2021-2034 ($Bn)
- 8.1 Key trends
- 8.2 Permanent
- 8.3 Temporary
Chapter 9 Market Estimates & Forecast, By Technique, 2021-2034 ($Bn)
- 9.1 Key trends
- 9.2 Visual inspection
- 9.3 Non-Destructive inspection
- 9.4 Structural health monitoring
- 9.5 Aerial and drone inspection
- 9.6 Underwater inspection
Chapter 10 Market Estimates & Forecast, By End Use Industry, 2021-2034 ($Bn)
- 10.1 Key trends
- 10.2 Government
- 10.3 Transportation
- 10.4 Private Sector
- 10.5 Others
Chapter 11 Market Estimates & Forecast, By Region, 2021-2034 ($Bn)
- 11.1 Key trends
- 11.2 North America
- 11.2.1 U.S.
- 11.2.2 Canada
- 11.3 Europe
- 11.3.1 UK
- 11.3.2 Germany
- 11.3.3 France
- 11.3.4 Italy
- 11.3.5 Spain
- 11.3.6 Russia
- 11.3.7 Rest of Europe
- 11.4 Asia Pacific
- 11.4.1 China
- 11.4.2 India
- 11.4.3 Japan
- 11.4.4 South Korea
- 11.4.5 ANZ
- 11.4.6 Rest of Asia Pacific
- 11.5 Latin America
- 11.5.1 Brazil
- 11.5.2 Mexico
- 11.5.3 Rest of Latin America
- 11.6 MEA
- 11.6.1 South Africa
- 11.6.2 Saudi Arabia
- 11.6.3 UAE
- 11.6.4 Rest of MEA
Chapter 12 Company Profiles
- 12.1 AECOM
- 12.2 American Rail Engineers
- 12.3 ATS Engineering
- 12.4 Ayres Associates
- 12.5 Burns & McDonnel
- 12.6 CEC Corporation
- 12.7 Collins
- 12.8 Infrastructure Preservation Corporation
- 12.9 Jacobs Engineering
- 12.10 Johnson, Mirmiran & Thompson
- 12.11 KCI Technologies
- 12.12 Mabey
- 12.13 Mistras
- 12.14 Patriot Rail Company
- 12.15 Stantec
- 12.16 TUV Rheinland
- 12.17 Volkert
- 12.18 WSP

