
PUBLISHER: Global Market Insights Inc. | PRODUCT CODE: 1685203

PUBLISHER: Global Market Insights Inc. | PRODUCT CODE: 1685203
Africa Transmission Lines Market Opportunity, Growth Drivers, Industry Trend Analysis, and Forecast 2025 - 2034
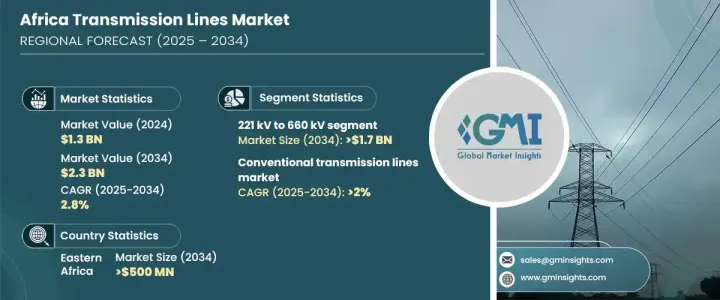
Africa Transmission Lines Market, valued at USD 1.3 billion in 2024, is on track for steady growth, with a projected CAGR of 2.8% from 2025 to 2034. This growth is being propelled by a surge in electricity demand, the drive to integrate renewable energy into the grid, and initiatives focused on enhancing regional connectivity. Governments, private companies, and international organizations are funneling significant investments into the region's transmission infrastructure. These investments aim to close the widening power gap and encourage economic development while also creating vast opportunities for innovation and strategic collaborations.
As urbanization, industrialization, and rural electrification efforts advance across the continent, the demand for robust and efficient transmission networks is becoming more pronounced. Sub-Saharan Africa, in particular, faces considerable electricity shortages that require major infrastructure investments to extend power access to underserved regions. Addressing this gap in electricity availability, especially in rural areas, has emerged as a top priority for industry stakeholders, further driving market expansion.
| Market Scope | |
|---|---|
| Start Year | 2024 |
| Forecast Year | 2025-2034 |
| Start Value | $1.3 Billion |
| Forecast Value | $2.3 Billion |
| CAGR | 2.8% |
The conventional transmission lines sector in Africa is poised for consistent growth, expected to increase at a CAGR of 2% through 2034. This market is benefiting from the rising need for electricity, ongoing efforts to modernize the power grid, and the increased incorporation of renewable energy sources. Noteworthy industry trends include increased investments in advanced materials, such as aluminum composite conductors, as well as the implementation of smart monitoring solutions to enhance the efficiency and reliability of electrical infrastructure.
The 221 kV to 660 kV voltage segment in the Africa transmission lines market is projected to generate USD 1.7 billion by 2034. The segment growth is largely fueled by the modernization of power infrastructure across the commercial, industrial, and utility sectors. Upgrading high-voltage transmission networks and integrating renewable energy into the national grids are key trends that are shaping the market outlook, positioning the segment for significant expansion.
Eastern Africa is expected to generate USD 500 million in transmission line investments by 2034. This growth is being driven by extensive rural electrification programs and the increasing adoption of cutting-edge technologies. The gap in electricity access between urban and rural areas remains a critical issue, leading to significant investments aimed at improving transmission networks in these regions. Furthermore, the move toward smart grids and the adoption of innovative technologies, such as high-temperature low-sag (HTLS) conductors and underground transmission systems, are gaining traction. These innovations are helping to enhance grid efficiency, reduce energy losses, and bolster overall grid reliability, further driving market growth.
Table of Contents
Chapter 1 Methodology & Scope
- 1.1 Market scope & definitions
- 1.2 Market estimates & forecast parameters
- 1.3 Forecast calculation
- 1.4 Data sources
- 1.4.1 Primary
- 1.4.2 Secondary
- 1.4.2.1 Paid
- 1.4.2.2 Public
Chapter 2 Industry Insights
- 2.1 Industry ecosystem analysis
- 2.2 Regulatory landscape
- 2.3 Industry impact forces
- 2.3.1 Growth drivers
- 2.3.2 Industry pitfalls & challenges
- 2.4 Growth potential analysis
- 2.5 Porter's Analysis
- 2.5.1 Bargaining power of suppliers
- 2.5.2 Bargaining power of buyers
- 2.5.3 Threat of new entrants
- 2.5.4 Threat of substitutes
- 2.6 PESTEL Analysis
Chapter 3 Competitive Landscape, 2024
- 3.1 Introduction
- 3.2 Strategic outlook
- 3.3 Innovation & sustainability landscape
Chapter 4 Market Size and Forecast, By Voltage, 2021 – 2034 (ckm, USD Billion)
- 4.1 Key trends
- 4.2 132 kV to 220 kV
- 4.3 221 kV to 660 kV
- 4.4 > 660 kV
Chapter 5 Market Size and Forecast, By Conductor, 2021 – 2034 (ckm, USD Billion)
- 5.1 Key trends
- 5.2 Conventional
- 5.3 High Temperature
- 5.4 Others
Chapter 6 Market Size and Forecast, By Region, 2021 – 2034 (ckm, USD Billion)
- 6.1 Key trends
- 6.2 Western Africa
- 6.3 Eastern Africa
- 6.4 Southern Africa
Chapter 7 Company Profiles
- 7.1 APAR Industries
- 7.2 Bekaert
- 7.3 CTC Global
- 7.4 Elsewedy Electric
- 7.5 Houston Wire & Cable
- 7.6 Hengtong Group
- 7.7 Nexans
- 7.8 Prysmian Group
- 7.9 KEC International
- 7.10 Kalpataru Power Transmission Limited
- 7.11 Midal Cables
- 7.12 Southwire Company
- 7.13 Sumitomo Electric Industries
- 7.14 ZTT

