
PUBLISHER: Global Market Insights Inc. | PRODUCT CODE: 1666986

PUBLISHER: Global Market Insights Inc. | PRODUCT CODE: 1666986
LNG Terminal Market Opportunity, Growth Drivers, Industry Trend Analysis, and Forecast 2025 - 2034
The Global LNG Terminal Market, valued at USD 7.9 billion in 2024, is projected to grow at a robust CAGR of 13.9% from 2025 to 2034. The shift towards cleaner energy sources and the global decline in coal and oil usage has significantly boosted the consumption of natural gas. Recognized for its efficiency and lower environmental impact, natural gas has become a preferred energy alternative. Its ability to burn more cleanly while releasing fewer greenhouse gases and pollutants aligns with the increasing global focus on sustainable energy solutions. Technological advancements in LNG infrastructure are also propelling market growth, making operations more efficient and reducing project costs. Key innovations, such as advancements in cryogenic storage and liquefaction processes, have enhanced the economic feasibility of LNG projects, ensuring a steady rise in market adoption.
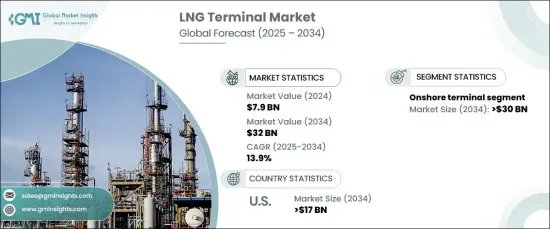
The onshore LNG terminal sector is expected to exceed USD 30 billion by 2034, driven by the pursuit of cost-efficient and technologically advanced solutions. Enhanced liquefaction methods, modernized storage systems, and streamlined regasification processes are transforming the operational landscape. The development of smaller, localized terminals is meeting the specific energy demands of industrial and remote applications, supporting broader energy accessibility. These advancements are accelerating the role of onshore terminals in the shift towards low-carbon energy systems, ensuring reliable and sustainable energy supplies.
| Market Scope | |
|---|---|
| Start Year | 2024 |
| Forecast Year | 2025-2034 |
| Start Value | $7.9 Billion |
| Forecast Value | $32 Billion |
| CAGR | 13.9% |
Simultaneously, the floating LNG terminal market is experiencing substantial momentum due to its flexibility and cost-effectiveness. Floating terminals designed to operate in offshore locations, offer mobility and eliminate the need for extensive onshore infrastructure. These terminals are benefiting from technological progress, improving safety and operational efficiency. Enhanced liquefaction capabilities, lower energy usage, and innovations to mitigate methane emissions are driving their appeal, ensuring a stronger foothold in the evolving energy market.
In the United States, the LNG terminal market is anticipated to surpass USD 17 billion by 2034. Growing demand for cleaner energy at both domestic and international levels is fueling investments in advanced terminal infrastructure. Upgraded facilities with state-of-the-art liquefaction and storage systems are enhancing efficiency while reducing operational costs. Additionally, the industry's focus on adopting eco-friendly technologies and strategies for emissions reduction is shaping a more sustainable energy framework. These advancements, coupled with increasing energy consumption and a transition towards environmentally conscious solutions, are positioning the United States as a key player in the global LNG landscape.
Table of Contents
Chapter 1 Methodology & Scope
- 1.1 Market definitions
- 1.2 Base estimates & calculations
- 1.3 Forecast calculation
- 1.4 Data sources
- 1.4.1 Primary
- 1.4.2 Secondary
- 1.4.2.1 Paid
- 1.4.2.2 Public
Chapter 2 Executive Summary
- 2.1 Industry synopsis, 2021 - 2034
Chapter 3 Industry Insights
- 3.1 Industry ecosystem analysis
- 3.2 Regulatory landscape
- 3.3 Industry impact forces
- 3.3.1 Growth drivers
- 3.3.2 Industry pitfalls & challenges
- 3.4 Growth potential analysis
- 3.5 Porter's analysis
- 3.5.1 Bargaining power of suppliers
- 3.5.2 Bargaining power of buyers
- 3.5.3 Threat of new entrants
- 3.5.4 Threat of substitutes
- 3.6 PESTEL analysis
Chapter 4 Competitive Landscape, 2024
- 4.1 Introduction
- 4.2 Strategic dashboard
- 4.3 Innovation & sustainability landscape
Chapter 5 Market Size and Forecast, By Terminal, 2021 – 2034 (MTPA, USD Million)
- 5.1 Key trends
- 5.2 Onshore
- 5.3 Floating
Chapter 6 Market Size and Forecast, By Region, 2021 – 2034 (MTPA, USD Million)
- 6.1 Key trends
- 6.2 North America
- 6.2.1 U.S.
- 6.2.2 Canada
- 6.2.3 Mexico
- 6.3 Europe
- 6.3.1 UK
- 6.3.2 France
- 6.3.3 Netherlands
- 6.3.4 Spain
- 6.3.5 Poland
- 6.3.6 Russia
- 6.3.7 Italy
- 6.4 Asia Pacific
- 6.4.1 China
- 6.4.2 India
- 6.4.3 Japan
- 6.4.4 South Korea
- 6.4.5 Australia
- 6.4.6 Thailand
- 6.4.7 Malaysia
- 6.4.8 Indonesia
- 6.5 Middle East & Africa
- 6.5.1 UAE
- 6.5.2 Qatar
- 6.5.3 Oman
- 6.5.4 Algeria
- 6.5.5 Egypt
- 6.6 Latin America
- 6.6.1 Brazil
- 6.6.2 Argentina
Chapter 7 Company Profiles
- 7.1 ADNOC
- 7.2 AES
- 7.3 BP
- 7.4 Chevron
- 7.5 CNPC
- 7.6 Engas
- 7.7 Engie
- 7.8 Eni
- 7.9 Equinor
- 7.10 ExxonMobil
- 7.11 Gazprom
- 7.12 KNPC
- 7.13 Pertamina
- 7.14 Petronas
- 7.15 Petronet
- 7.16 Qatar Energy
- 7.17 Repsol
- 7.18 Shell
- 7.19 Total
- 7.20 Vopak

