
PUBLISHER: Global Market Insights Inc. | PRODUCT CODE: 1666716

PUBLISHER: Global Market Insights Inc. | PRODUCT CODE: 1666716
Asia Pacific Stationary Battery Storage Market Opportunity, Growth Drivers, Industry Trend Analysis, and Forecast 2025 - 2034
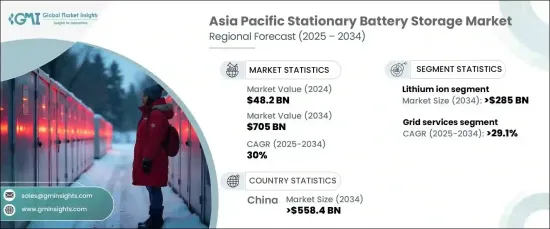
Asia Pacific Stationary Battery Storage Market was valued at USD 48.2 billion in 2024 and is expected to grow at an impressive CAGR of 30% from 2024 to 2034. This surge is largely attributed to the region's increasing focus on incorporating renewable energy sources, such as solar and wind, into existing power grids. Stationary battery storage systems are pivotal in storing surplus energy during periods of low demand and releasing it during peak usage, ensuring grid stability and efficient energy utilization.
Governments across the Asia Pacific region are emphasizing energy storage technologies as a key component of their climate action strategies. These initiatives are driving advancements in energy storage solutions to support renewable energy goals, enhance grid reliability, and promote energy security.
| Market Scope | |
|---|---|
| Start Year | 2024 |
| Forecast Year | 2025-2034 |
| Start Value | $48.2 Billion |
| Forecast Value | $705 Billion |
| CAGR | 30% |
The market is segmented by battery types, including lithium-ion, sodium-sulfur, lead-acid, flow batteries, and others. Among these, the lithium-ion segment is expected to dominate, with its market value projected to exceed USD 285 billion by 2034. Private sector investments in lithium-ion battery storage projects are also on the rise, with numerous energy companies and technology firms committing resources to these technologies. The growing interest in residential energy storage solutions is further propelling market growth, particularly in regions where energy independence and cost savings are key motivators.
In terms of application, the stationary battery storage market is divided into grid services, behind-the-meter, and off-grid systems. The grid services segment is anticipated to witness a CAGR of over 29.1% during the forecast period. As renewable energy sources become more prominent across the region, the importance of managing energy supply and demand fluctuations is growing.
Stationary battery storage systems provide an effective solution to address these challenges. They enable the storage of excess energy generated during periods of high renewable energy production and facilitate its release when energy demand peaks or renewable generation decreases. This functionality not only stabilizes the grid but also minimizes the risks of power outages, ensuring consistent energy availability.
The Asia Pacific stationary battery storage market continues to expand due to its critical role in supporting renewable energy integration and enhancing energy infrastructure across the region. With rapid technological advancements and increasing investments, the market is poised for significant growth in the coming years.
Table of Contents
Chapter 1 Methodology & Scope
- 1.1 Market definitions
- 1.2 Base estimates & calculations
- 1.3 Forecast calculation
- 1.4 Data sources
- 1.4.1 Primary
- 1.4.2 Secondary
- 1.4.2.1 Paid
- 1.4.2.2 Public
Chapter 2 Industry Insights
- 2.1 Industry ecosystem analysis
- 2.2 Regulatory landscape
- 2.3 Industry impact forces
- 2.3.1 Growth drivers
- 2.3.2 Industry pitfalls & challenges
- 2.4 Growth potential analysis
- 2.5 Porter's analysis
- 2.5.1 Bargaining power of suppliers
- 2.5.2 Bargaining power of buyers
- 2.5.3 Threat of new entrants
- 2.5.4 Threat of substitutes
- 2.6 PESTEL analysis
Chapter 3 Competitive landscape, 2024
- 3.1 Strategic dashboard
- 3.2 Innovation & sustainability landscape
Chapter 4 Market Size and Forecast, By Battery, 2021 – 2034 (USD Million, MW)
- 4.1 Key trends
- 4.2 Lithium ion
- 4.2.1 LFP
- 4.2.2 NMC
- 4.2.3 Others
- 4.3 Sodium sulphur
- 4.4 Lead acid
- 4.5 Flow battery
- 4.6 Others
Chapter 5 Market Size and Forecast, By Application, 2021 – 2034 (USD Million, MW)
- 5.1 Key trends
- 5.2 Grid services
- 5.2.1 Frequency regulation
- 5.2.2 Flexible ramping
- 5.2.3 Black start services
- 5.2.4 Energy shifting & capacity deferral
- 5.2.5 T & D congestion relief
- 5.2.6 Capacity firming
- 5.2.7 Reduced RE curtailment
- 5.2.8 Reduced reliance on diesel gensets
- 5.3 Behind the meter
- 5.3.1 Electricity consumers
- 5.3.2 System operation
- 5.3.3 Mini grids
- 5.4 Off grid
Chapter 6 Market Size and Forecast, By Region, 2021 – 2034 (USD Million, MW)
- 6.1 Key trends
- 6.2 China
- 6.3 Japan
- 6.4 South Korea
- 6.5 India
- 6.6 Australia
Chapter 7 Company Profiles
- 7.1 BYD
- 7.2 CATL
- 7.3 Hitachi Energy
- 7.4 Hoppecke
- 7.5 Johnson Controls
- 7.6 Philips
- 7.7 LG Chem
- 7.8 Panasonic
- 7.9 Samsung SDI
- 7.10 Siemens Energy
- 7.11 Tesla
- 7.12 Toshiba
- 7.13 Varta

