
PUBLISHER: Global Market Insights Inc. | PRODUCT CODE: 1684762

PUBLISHER: Global Market Insights Inc. | PRODUCT CODE: 1684762
Conventional Overhead Conductor Market Opportunity, Growth Drivers, Industry Trend Analysis, and Forecast 2025 - 2034
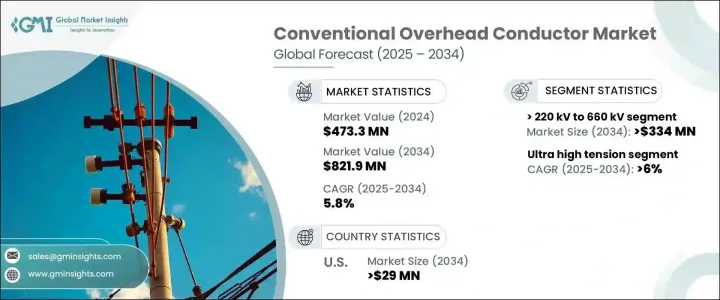
The Global Conventional Overhead Conductor Market reached USD 473.3 million in 2024 and is expected to grow at a robust CAGR of 5.8% from 2025 to 2034. This growth is primarily driven by innovations in material science, increasing demand for electricity, and the pressing need to upgrade outdated power infrastructure. As nations continue to modernize their power grids to meet the needs of expanding populations and industries, the demand for more efficient and reliable overhead conductors is surging.
Technological advancements, such as the development of high-strength, lightweight conductors, are helping improve transmission performance and minimize energy loss, making these solutions more attractive. Additionally, new materials like advanced aluminum alloys and composite cores are addressing long-standing challenges, including conductor sag and thermal instability, positioning them as ideal choices for high-capacity transmission applications. Utilities, industries, and commercial sectors are rapidly adopting these upgraded systems to ensure greater operational efficiency and sustainability.
| Market Scope | |
|---|---|
| Start Year | 2024 |
| Forecast Year | 2025-2034 |
| Start Value | $473.3 Million |
| Forecast Value | $821.9 Million |
| CAGR | 5.8% |
The market for conventional overhead conductors in the >220 kV to 660 kV segment is anticipated to generate USD 334 million by 2034, reflecting a major transformation in the way electricity is transmitted. This surge is driven by the ongoing efforts to upgrade aging infrastructure, boost grid efficiency, and integrate renewable energy sources into national power grids. Governments and utilities are focused on replacing outdated systems with advanced high-voltage solutions to enhance long-distance transmission capabilities. As a result, this sector is poised for significant growth, supported by rising energy demands and the need to improve transmission infrastructure to accommodate modern needs.
The ultra-high-tension segment within the conventional overhead conductor market is expected to grow at a CAGR of 6% through 2034. The growing electricity demand in emerging economies, combined with supportive government policies that encourage cross-border power transmission, is fueling this expansion. As countries seek to improve their energy security and provide uninterrupted power across vast distances, the need for advanced conductors that can withstand extreme conditions and ensure reliable long-distance transmission is greater than ever. This market growth is also bolstered by innovations in conductor technology that make ultra-high-tension systems more cost-effective and reliable for both utilities and industrial applications.
The U.S. conventional overhead conductor market is set to generate USD 29 million by 2034, with a focus on enhancing grid reliability and meeting the demands of rising electricity consumption. Investments in modernizing the grid are driving the adoption of advanced conductor materials, including high-temperature alloys and composite cores, which are designed to reduce energy losses and boost overall system performance. Utilities across the nation are increasingly prioritizing the replacement of outdated infrastructure to meet modern energy demands and improve efficiency, positioning the U.S. as a key player in the growth of the conventional overhead conductor market.
Table of Contents
Chapter 1 Methodology & Scope
- 1.1 Market scope & definitions
- 1.2 Market estimates & forecast parameters
- 1.3 Forecast calculation
- 1.4 Data sources
- 1.4.1 Primary
- 1.4.2 Secondary
- 1.4.2.1 Paid
- 1.4.2.2 Public
Chapter 2 Executive Summary
- 2.1 Industry synopsis, 2021 - 2034
Chapter 3 Industry Insights
- 3.1 Industry ecosystem analysis
- 3.2 Regulatory landscape
- 3.3 Industry impact forces
- 3.3.1 Growth drivers
- 3.3.2 Industry pitfalls & challenges
- 3.4 Growth potential analysis
- 3.5 Porter's analysis
- 3.5.1 Bargaining power of suppliers
- 3.5.2 Bargaining power of buyers
- 3.5.3 Threat of new entrants
- 3.5.4 Threat of substitutes
- 3.6 PESTEL analysis
Chapter 4 Competitive Landscape, 2024
- 4.1 Introduction
- 4.2 Strategic outlook
- 4.3 Innovation & sustainability landscape
Chapter 5 Market Size and Forecast, By Product, 2021 – 2034 (km, USD Million)
- 5.1 Key trends
- 5.2 ACSR
- 5.3 AAAC
- 5.4 ACAR
- 5.5 AACSR
- 5.6 AAC
Chapter 6 Market Size and Forecast, By Voltage, 2021 – 2034 (km, USD Million)
- 6.1 Key trends
- 6.2 132 kV to 220 kV
- 6.3 > 220 kV to 660 kV
- 6.4 > 660 kV
Chapter 7 Market Size and Forecast, By Application, 2021 – 2034 (km, USD Million)
- 7.1 Key trends
- 7.2 High tension
- 7.3 Extra high tension
- 7.4 Ultra high tension
Chapter 8 Market Size and Forecast, By Region, 2021 – 2034 (km, USD Million)
- 8.1 Key trends
- 8.2 North America
- 8.2.1 U.S.
- 8.2.2 Canada
- 8.2.3 Mexico
- 8.3 Europe
- 8.3.1 UK
- 8.3.2 Italy
- 8.3.3 France
- 8.3.4 Germany
- 8.3.5 Sweden
- 8.4 Asia Pacific
- 8.4.1 China
- 8.4.2 Australia
- 8.4.3 India
- 8.4.4 Indonesia
- 8.4.5 New Zealand
- 8.5 Middle East & Africa
- 8.5.1 UAE
- 8.5.2 Saudi Arabia
- 8.5.3 South Africa
- 8.6 Latin America
- 8.6.1 Brazil
- 8.6.2 Argentina
Chapter 9 Company Profiles
- 9.1 3M
- 9.2 Bekaert
- 9.3 Cabcon India
- 9.4 CMI
- 9.5 CTC Global
- 9.6 Eland Cables
- 9.7 Elsewedy Electric
- 9.8 Galaxy Transmissions
- 9.9 Gupta Power
- 9.10 Hindustan Urban Infrastructure
- 9.11 KEI Industries
- 9.12 LS Cable & System
- 9.13 Nexans
- 9.14 Prysmian Group
- 9.15 Priority Wire & Cable, Inc.
- 9.16 Special Cables
- 9.17 Sterlite Power
- 9.18 Sumitomo Electric
- 9.19 Southwire Company, LLC
- 9.20 Tropical Cable & Conductor
- 9.21 ZMS Cable
- 9.22 ZTT

