
PUBLISHER: Global Market Insights Inc. | PRODUCT CODE: 1684773

PUBLISHER: Global Market Insights Inc. | PRODUCT CODE: 1684773
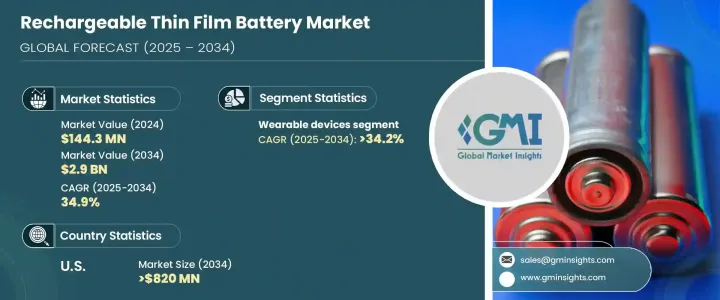
Rechargeable Thin Film Battery Market Opportunity, Growth Drivers, Industry Trend Analysis, and Forecast 2025 - 2034
The Global Rechargeable Thin Film Battery Market was valued at USD 144.3 million in 2024 and is expected to grow at a remarkable CAGR of 34.9% from 2025 to 2034. This growth is primarily driven by the increasing demand for compact, efficient, and reliable energy storage solutions across a wide range of industries. Thin film batteries are gaining traction due to their unique advantages, including their small size, lightweight design, and ability to deliver consistent performance over an extended lifecycle. These features make them ideal for applications in portable devices, particularly in sectors such as medical technology, wearables, and smart cards.
The rapid expansion of the Internet of Things (IoT) is further fueling the need for space-saving and dependable energy sources, creating significant opportunities for thin film battery manufacturers. Additionally, advancements in battery technology, such as improvements in energy density, safety, and sustainability, are enhancing the appeal of these batteries. As industries increasingly prioritize environmentally friendly and high-performance energy solutions, thin film batteries are emerging as a preferred choice. The market is also witnessing growing investments in research and development, which are accelerating innovation and driving the adoption of these advanced energy storage systems.
| Market Scope | |
|---|---|
| Start Year | 2024 |
| Forecast Year | 2025-2034 |
| Start Value | $144.3 Million |
| Forecast Value | $2.9 Billion |
| CAGR | 34.9% |
The wearable technology sector is expected to be a key driver of growth in the rechargeable thin film batteries market, with demand projected to grow at a CAGR of 34.2% through 2034. Thin film batteries are particularly well-suited for wearable devices due to their high energy density, compact form factor, and fast charging capabilities. These attributes enable manufacturers to design miniaturized and aesthetically appealing devices, such as smartwatches, fitness trackers, and health monitoring gadgets, that offer enhanced efficiency and longer battery life. As consumer demand for wearable technology continues to rise, thin film batteries are becoming an essential component in the development of innovative and durable products. Their ability to meet the stringent requirements of the wearables industry positions them as a critical enabler of growth in this segment.
The U.S. rechargeable thin film battery market is anticipated to generate USD 820 million by 2034, driven by the increasing demand for compact energy storage solutions in advanced electronics, wearables, and medical devices. Innovations in battery design, particularly in energy density and safety, are empowering U.S. manufacturers to produce cutting-edge batteries that cater to the evolving needs of these sectors. The growing adoption of IoT devices, smart cards, and next-generation medical implants is further contributing to market expansion. Additionally, the focus on sustainable and environmentally friendly technologies is accelerating the shift toward solid-state thin film batteries. Collaborations between scientific researchers and technology companies are playing a pivotal role in advancing the development and commercialization of these energy storage solutions. These efforts are positioning the U.S. as a leader in the global rechargeable thin film batteries market, ensuring its competitiveness in this rapidly evolving landscape.
Table of Contents
Chapter 1 Methodology & Scope
- 1.1 Market definitions
- 1.2 Base estimates & calculations
- 1.3 Forecast calculation
- 1.4 Data sources
- 1.4.1 Primary
- 1.4.2 Secondary
- 1.4.2.1 Paid
- 1.4.2.2 Public
Chapter 2 Executive Summary
- 2.1 Industry synopsis, 2021 – 2034
Chapter 3 Industry Insights
- 3.1 Industry ecosystem analysis
- 3.2 Regulatory landscape
- 3.3 Industry impact forces
- 3.3.1 Growth drivers
- 3.3.2 Industry pitfalls & challenges
- 3.4 Growth potential analysis
- 3.5 Porter's Analysis
- 3.5.1 Bargaining power of suppliers
- 3.5.2 Bargaining power of buyers
- 3.5.3 Threat of new entrants
- 3.5.4 Threat of substitutes
- 3.6 PESTEL Analysis
Chapter 4 Competitive landscape, 2024
- 4.1 Strategic dashboard
- 4.2 Innovation & sustainability landscape
Chapter 5 Market Size and Forecast, By Application, 2021 – 2034 (USD Million)
- 5.1 Key trends
- 5.2 Wearable devices
- 5.3 Medical
- 5.4 Smart cards
- 5.5 Consumer products
- 5.6 Others
Chapter 6 Market Size and Forecast, By Region, 2021 – 2034 (USD Million)
- 6.1 Key trends
- 6.2 North America
- 6.2.1 U.S.
- 6.2.2 Canada
- 6.2.3 Mexico
- 6.3 Europe
- 6.3.1 Germany
- 6.3.2 UK
- 6.3.3 France
- 6.3.4 Italy
- 6.3.5 Spain
- 6.3.6 Austria
- 6.3.7 Sweden
- 6.4 Asia Pacific
- 6.4.1 China
- 6.4.2 Japan
- 6.4.3 South Korea
- 6.4.4 India
- 6.4.5 Australia
- 6.5 Rest of World
- 6.5.1 Brazil
- 6.5.2 UAE
- 6.5.3 Saudi Arabia
Chapter 7 Company Profiles
- 7.1 BrightVolt
- 7.2 Cymbet
- 7.3 Enfucell
- 7.4 Ilika
- 7.5 Imprint Energy
- 7.6 Ion Storage Systems
- 7.7 ITEN
- 7.8 Jenax
- 7.9 Johnson Energy Storage
- 7.10 Molex
- 7.11 Prieto Battery
- 7.12 STMicroelectronics

