
PUBLISHER: Global Market Insights Inc. | PRODUCT CODE: 1667141

PUBLISHER: Global Market Insights Inc. | PRODUCT CODE: 1667141
Europe AMI Electric Meter Market Opportunity, Growth Drivers, Industry Trend Analysis, and Forecast 2025 - 2034
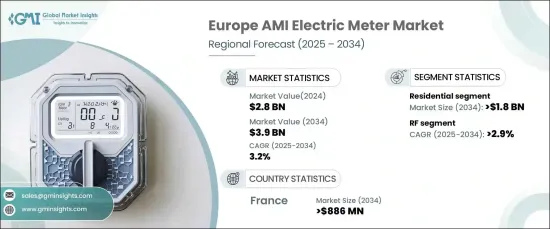
Europe AMI Electric Meter Market was valued at USD 2.8 billion in 2024 and is poised for steady growth, projected to expand at a CAGR of 3.2% from 2025 to 2034. This market expansion is driven by a combination of factors, including the increasing adoption of smart grid technologies, energy efficiency initiatives, and advancements in real-time data analytics. As energy demands continue to rise across Europe, governments are implementing proactive measures to address these challenges.
Policies like the EU's Clean Energy for All Europeans package have significantly accelerated the adoption of smart meters. These cutting-edge meters enable utilities to monitor energy usage in real-time, enhancing grid operations, optimizing energy distribution, and improving service delivery. With the growing shift towards renewable energy sources and the widespread adoption of electric vehicles (EVs), the demand for innovative metering solutions is more crucial than ever. The integration of smart metering systems supports the transition to a more sustainable, efficient, and resilient energy landscape.
| Market Scope | |
|---|---|
| Start Year | 2024 |
| Forecast Year | 2025-2034 |
| Start Value | $2.8 Billion |
| Forecast Value | $3.9 Billion |
| CAGR | 3.2% |
In the residential sector, demand for AMI electric meters is expected to dominate the market, with projections estimating a value of USD 1.8 billion by 2034. Governments across the region are mandating the rollout of smart meters in residential areas, aimed at improving energy efficiency, optimizing grid management, and ensuring transparent billing. These government-driven initiatives align with national and EU-wide energy directives, promoting a greener future and offering consumers more control over their energy usage. Furthermore, increasing consumer awareness of environmental issues and the desire to reduce energy consumption is driving the demand for smart energy solutions that enable real-time monitoring and greater control.
From a technological standpoint, the radio frequency (RF) segment is set for consistent growth, projected to achieve a CAGR of 2.9% through 2034. RF-based AMI meters, which rely on wireless communication, eliminate the need for extensive physical wiring, thus lowering both installation and maintenance costs. This technology offers flexibility, allowing for quick and scalable deployments across various sectors such as residential, commercial, and industrial. As energy demands evolve, RF systems give utilities the ability to expand their smart meter networks efficiently, making them a popular choice for utility providers and consumers alike.
Meanwhile, the France AMI water meters market is expected to generate USD 886 million by 2034. This growth is fueled by government policies focusing on water conservation and resource management. The French government's commitment to sustainability, including efforts to reduce water waste and optimize distribution system efficiency, has accelerated the adoption of smart water meters. With regulatory measures in place, the widespread deployment of advanced metering systems across the country is anticipated to increase significantly in the coming years.
Table of Contents
Chapter 1 Methodology & Scope
- 1.1 Market definitions
- 1.2 Base estimates & calculations
- 1.3 Forecast calculation
- 1.4 Data sources
- 1.4.1 Primary
- 1.4.2 Secondary
- 1.4.2.1 Paid
- 1.4.2.2 Public
Chapter 2 Industry Insights
- 2.1 Industry ecosystem analysis
- 2.2 Regulatory landscape
- 2.3 Industry impact forces
- 2.3.1 Growth drivers
- 2.3.2 Industry pitfalls & challenges
- 2.4 Growth potential analysis
- 2.5 Porter's analysis
- 2.5.1 Bargaining power of suppliers
- 2.5.2 Bargaining power of buyers
- 2.5.3 Threat of new entrants
- 2.5.4 Threat of substitutes
- 2.6 PESTEL analysis
Chapter 3 Competitive landscape, 2024
- 3.1 Strategic dashboard
- 3.2 Innovation & sustainability landscape
Chapter 4 Market Size and Forecast, By Application, 2021 – 2034 (USD Million, ‘000 Units)
- 4.1 Key trends
- 4.2 Residential
- 4.3 Commercial
- 4.4 Utility
Chapter 5 Market Size and Forecast, By Technology, 2021 – 2034 (USD Million, ‘000 Units)
- 5.1 Key trends
- 5.2 RF
- 5.3 PLC
- 5.4 Cellular
Chapter 6 Market Size and Forecast, By Phase, 2021 – 2034 (USD Million, ‘000 Units)
- 6.1 Key trends
- 6.2 Single
- 6.3 Three
Chapter 7 Market Size and Forecast, By Country, 2021 – 2034 (USD Million, ‘000 Units)
- 7.1 Key trends
- 7.2 UK
- 7.3 France
- 7.4 Germany
- 7.5 Italy
- 7.6 Russia
- 7.7 Spain
Chapter 8 Company Profiles
- 8.1 Aclara Technologies
- 8.2 Apator
- 8.3 Arad Group
- 8.4 Badger Meter
- 8.5 BMETERS
- 8.6 Diehl Stiftung
- 8.7 Honeywell International
- 8.8 Itron
- 8.9 Kamstrup
- 8.10 Landis+Gyr
- 8.11 Nepune Technology Group
- 8.12 Ningbo Water Meter
- 8.13 Schneider Electric
- 8.14 Sensus
- 8.15 Siemens
- 8.16 Sontex
- 8.17 Zenner International

