
PUBLISHER: Global Market Insights Inc. | PRODUCT CODE: 1667052

PUBLISHER: Global Market Insights Inc. | PRODUCT CODE: 1667052
Asia Pacific Overhead Conductor Market Opportunity, Growth Drivers, Industry Trend Analysis, and Forecast 2025 - 2034
Asia Pacific Overhead Conductor Market was valued at USD 389.6 million in 2024 and is expected to grow at a robust CAGR of 7.9% from 2025 to 2034. This growth is largely driven by the increasing demand for electricity across the region, spurred by rapid industrialization, urban expansion, and population growth. As more regions require a stable and continuous power supply, utilities and private companies are upgrading existing power grids and constructing new transmission networks. This transformation is necessary to meet growing energy needs and to support economic development in both urban and rural areas. Furthermore, advances in conductor technology are enhancing the efficiency and reliability of power transmission systems. The introduction of high-temperature low-sag (HTLS) conductors has been particularly effective in reducing energy losses, mitigating the effects of aging infrastructure, and alleviating grid congestion. These innovations are ensuring that energy is transmitted more efficiently, helping meet the growing demand while reducing environmental impacts.
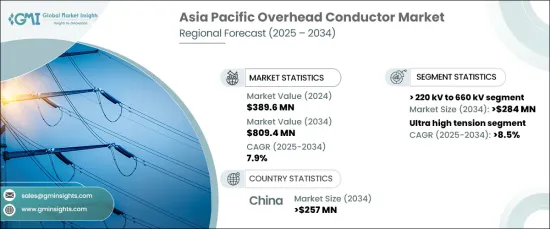
The market for overhead conductors rated between 220 kV and 660 kV is projected to generate USD 284 million by 2034. The demand for these high-capacity conductors is being driven by significant changes in the way electricity infrastructure is reconfigured, especially in the commercial, industrial, and utility sectors. Modernization efforts in these sectors aim to facilitate longer-distance power transmission, allowing for greater energy efficiency. This shift is further complemented by the integration of renewable energy sources like wind and solar power into national power grids, which requires more advanced transmission capabilities. Efforts to upgrade existing transmission networks with high-voltage systems are expected to significantly influence market dynamics.
| Market Scope | |
|---|---|
| Start Year | 2024 |
| Forecast Year | 2025-2034 |
| Start Value | $389.6 Million |
| Forecast Value | $809.4 Million |
| CAGR | 7.9% |
The ultra-high tension overhead conductor market is forecast to grow at a CAGR of 8.5% through 2034. Several factors are driving this expansion, including large-scale investments in renewable energy projects, particularly solar and wind energy plants, and an increased demand for sustainable energy solutions. As developing regions face rising electricity consumption, the adoption of high-tension conductors is becoming more widespread. Policies that promote cross-border transmission are also fueling demand for these advanced conductors, helping to meet electricity needs across regions with different power supply capacities. Additionally, the rapid urbanization in both emerging and developed economies, coupled with rising construction activities, is boosting the need for stronger and more reliable transmission systems.
China overhead conductor market is projected to reach USD 257 million by 2034. This growth is attributed to the country's focus on improving the reliability of power supplies, addressing the growing electricity demand, and enhancing grid connectivity in remote and underserved areas. Shifting power consumption patterns and rising investments to expand power generation capacity are expected to contribute significantly to market growth. Additionally, intra-regional power agreements designed to balance energy distribution between surplus and deficit areas are expected to further increase demand for overhead conductors, particularly in landlocked regions where electricity access is a priority.
Table of Contents
Chapter 1 Methodology & Scope
- 1.1 Market scope & definitions
- 1.2 Market estimates & forecast parameters
- 1.3 Forecast calculation
- 1.4 Data sources
- 1.4.1 Primary
- 1.4.2 Secondary
- 1.4.2.1 Paid
- 1.4.2.2 Public
Chapter 2 Industry Insights
- 2.1 Industry ecosystem analysis
- 2.2 Regulatory landscape
- 2.3 Industry impact forces
- 2.3.1 Growth drivers
- 2.3.2 Industry pitfalls & challenges
- 2.4 Growth potential analysis
- 2.5 Porter's analysis
- 2.5.1 Bargaining power of suppliers
- 2.5.2 Bargaining power of buyers
- 2.5.3 Threat of new entrants
- 2.5.4 Threat of substitutes
- 2.6 PESTEL analysis
Chapter 3 Competitive Landscape, 2024
- 3.1 Introduction
- 3.2 Strategic outlook
- 3.3 Innovation & sustainability landscape
Chapter 4 Market Size and Forecast, By Product, 2021 – 2034 (km, USD Million)
- 4.1 Key trends
- 4.2 Conventional
- 4.2.1 ACSR
- 4.2.2 AAAC
- 4.2.3 ACAR
- 4.2.4 AACSR
- 4.2.5 AAC
- 4.3 High temperature
- 4.3.1 Tal
- 4.3.2 ZTAl
- 4.3.3 Others
- 4.4 Others
- 4.4.1 ACFR
- 4.4.2 ACCR
- 4.4.3 ACCC
- 4.4.4 CRAC
- 4.4.5 Gap conductors
- 4.4.6 Others
Chapter 5 Market Size and Forecast, By Voltage, 2021 – 2034 (km, USD Million)
- 5.1 Key trends
- 5.2 132 kV to 220 kV
- 5.3 > 220 kV to 660 kV
- 5.4 > 660 kV
Chapter 6 Market Size and Forecast, By Rated Strength, 2021 – 2034 (km, USD Million)
- 6.1 Key trends
- 6.2 High strength
- 6.3 Extra high strength
- 6.4 Ultra high strength
Chapter 7 Market Size and Forecast, By Current, 2021 – 2034 (km, USD Million)
- 7.1 Key trends
- 7.2 HVAC
- 7.3 HVDC
Chapter 8 Market Size and Forecast, By Application, 2021 – 2034 (km, USD Million)
- 8.1 Key trends
- 8.2 High tension
- 8.3 Extra high tension
- 8.4 Ultra high tension
Chapter 9 Market Size and Forecast, By Country, 2021 – 2034 (km, USD Million)
- 9.1 Key trends
- 9.2 China
- 9.3 Australia
- 9.4 India
- 9.5 Japan
- 9.6 South Korea
- 9.7 Indonesia
- 9.8 New Zealand
- 9.9 Malaysia
Chapter 10 Company Profiles
- 10.1 3M
- 10.2 Alfanar
- 10.3 Apar
- 10.4 Cabcon India
- 10.5 CTC Global
- 10.6 Elsewedy Electric
- 10.7 Gupta Power
- 10.8 Hindustan Urban Infrastructure
- 10.9 KEI Industries
- 10.10 LS Cable System
- 10.11 Neccon
- 10.12 Nexans
- 10.13 Prysmian
- 10.14 Special Cables
- 10.15 Sterlite Power
- 10.16 Sumitomo Electric
- 10.17 Tropical Cable Conductor
- 10.18 ZTT

