
PUBLISHER: Global Market Insights Inc. | PRODUCT CODE: 1666578

PUBLISHER: Global Market Insights Inc. | PRODUCT CODE: 1666578
Asia Pacific Lead Acid Battery Market Opportunity, Growth Drivers, Industry Trend Analysis, and Forecast 2025 - 2034
Asia Pacific Lead Acid Battery Market reached USD 53.1 billion in 2024 and is projected to grow at a CAGR of 3.3% between 2025 and 2034. Lead acid batteries are gaining popularity due to their impressive energy capacity, affordability, reliability, and safety. These advantages have made them an essential choice across numerous industries, further driving market expansion. With advancements in energy storage solutions, the growing demand for uninterrupted and dependable power has spurred a surge in applications, including the increasing need for backup power sources. Furthermore, as technology continues to evolve and the world becomes increasingly reliant on digital systems, energy storage is becoming more crucial. The anticipated reduction in battery prices in the coming years, alongside lower implementation costs, will make lead acid batteries even more competitive compared to other energy storage technologies.
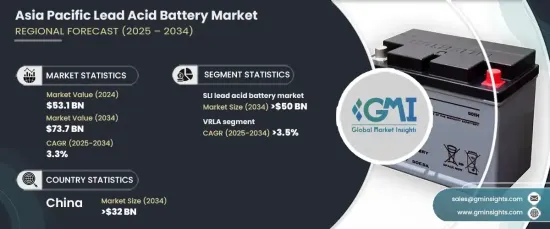
As the internet and information technology continue to grow globally, there is a heightened need for reliable power. This trend has opened new business opportunities for lead acid batteries, especially for industries that require long-lasting, cost-effective energy solutions. The SLI (Starting, Lighting, and Ignition) battery segment within this market is expected to generate USD 50 billion by 2034. As reliance on electronics increases, there is a rising demand for dependable power sources, driving this market's growth. At the same time, an increase in foreign direct investment in developing regions is accelerating infrastructure development, making capital equipment more accessible and further propelling the market forward.
| Market Scope | |
|---|---|
| Start Year | 2024 |
| Forecast Year | 2025-2034 |
| Start Value | $53.1 Billion |
| Forecast Value | $73.7 Billion |
| CAGR | 3.3% |
The VRLA (Valve-Regulated Lead Acid) battery segment is expected to grow at a CAGR of 3.5% through 2034. The adoption of VRLA batteries is driven by their numerous advantages, such as reduced electrolyte evaporation, minimal spillage, and enhanced temperature resistance. These batteries also offer improved durability, with resistance to shock and vibration, which is critical in various industrial applications. Compared to traditional flooded batteries, VRLA batteries are also more cost-effective in terms of installation and maintenance, making them a highly sought-after option. Their better energy density and increased safety features further boost their appeal in both commercial and residential sectors.
In China, the lead acid battery market is projected to generate USD 32 billion by 2034. This growth is largely driven by rising automobile production and the need for reliable and efficient power supply systems. Furthermore, the demand for high-capacity batteries is growing in industries like telecommunications, UPS systems, inverters, and control systems. The availability and affordability of energy storage solutions are making them more accessible, promoting the continued growth of the lead acid battery market in the region, which is expected to remain a key player in the industry throughout the forecast period.
Table of Contents
Chapter 1 Methodology & Scope
- 1.1 Market scope & definitions
- 1.2 Market estimates & forecast parameters
- 1.3 Forecast calculation
- 1.4 Data sources
- 1.4.1 Primary
- 1.4.2 Secondary
- 1.4.2.1 Paid
- 1.4.2.2 Public
Chapter 2 Industry Insights
- 2.1 Industry ecosystem analysis
- 2.2 Regulatory landscape
- 2.3 Industry impact forces
- 2.3.1 Growth drivers
- 2.3.2 Industry pitfalls & challenges
- 2.4 Growth potential analysis
- 2.5 Porter's Analysis
- 2.5.1 Bargaining power of suppliers
- 2.5.2 Bargaining power of buyers
- 2.5.3 Threat of new entrants
- 2.5.4 Threat of substitutes
- 2.6 PESTEL Analysis
Chapter 3 Competitive Landscape, 2024
- 3.1 Introduction
- 3.2 Strategic outlook
- 3.3 Innovation & sustainability landscape
Chapter 4 Market Size and Forecast, By Application, 2021 – 2034 (Million Units & USD Million)
- 4.1 Key trends
- 4.2 Stationary
- 4.2.1 Telecommunications
- 4.2.2 UPS
- 4.2.3 Control & switchgear
- 4.2.4 Others
- 4.3 Motive
- 4.4 SLI
- 4.4.1 Automobiles
- 4.4.2 Motorcycles
Chapter 5 Market Size and Forecast, By Construction, 2021 – 2034 (Million Units & USD Million)
- 5.1 Key trends
- 5.2 Flooded
- 5.3 VRLA
- 5.3.1 AGM
- 5.3.2 GEL
Chapter 6 Market Size and Forecast, By Sales Channel, 2021 – 2034 (Million Units & USD Million)
- 6.1 Key trends
- 6.2 OEM
- 6.3 Aftermarket
Chapter 7 Market Size and Forecast, By Country, 2021 – 2034 (Million Units & USD Million)
- 7.1 Key trends
- 7.2 China
- 7.3 Japan
- 7.4 India
- 7.5 South Korea
- 7.6 Australia
- 7.7 Indonesia
- 7.8 Malaysia
- 7.9 Thailand
- 7.10 Philippines
- 7.11 Vietnam
- 7.12 Singapore
Chapter 8 Company Profiles
- 8.1 A123 Systems
- 8.2 Amara Raja Group
- 8.3 B.B. Battery
- 8.4 C&D Technologies
- 8.5 Chaowei Power Holdings
- 8.6 Clarios
- 8.7 Crown Battery
- 8.8 East Penn Manufacturing
- 8.9 EnerSys
- 8.10 Exide Industries
- 8.11 First National Battery
- 8.12 Furukawa Battery
- 8.13 GS Yuasa International
- 8.14 HOPPECKE Battery
- 8.15 Leoch International Technology
- 8.16 Luminous
- 8.17 MUTLU
- 8.18 Narada Asia Pacific
- 8.19 Okaya Power
- 8.20 Zibo Torch Energy

