
PUBLISHER: Global Market Insights Inc. | PRODUCT CODE: 1666525

PUBLISHER: Global Market Insights Inc. | PRODUCT CODE: 1666525
Europe Fire Tube Industrial Boiler Market Opportunity, Growth Drivers, Industry Trend Analysis, and Forecast 2025 - 2034
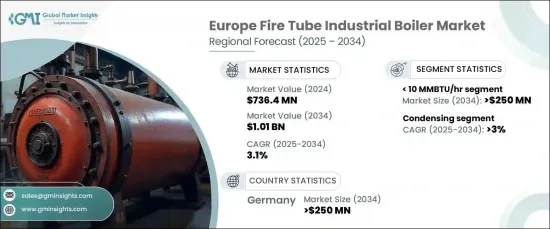
Europe Fire Tube Industrial Boiler Market was valued at USD 736.4 million in 2024 and is anticipated to grow at a CAGR of 3.1% from 2025 to 2034. This growth is largely fueled by the ongoing expansion of industrial sectors such as manufacturing and food processing, which require efficient and reliable heating solutions. The demand for fire tube boilers is further driven by the introduction of stricter energy efficiency regulations and emission standards. As governments across Europe tighten their rules on energy consumption and greenhouse gas emissions, businesses are increasingly investing in technologies that help lower operational costs and ensure compliance with these regulations.
The continuous rise in construction projects, including residential buildings, manufacturing plants, and infrastructure development, propels the demand for industrial boilers. Alongside this, environmental concerns are prompting a surge in technological innovations, focusing on the development of eco-friendly and energy-efficient boiler systems. These innovations aim to not only enhance the efficiency of heating systems but also minimize their environmental footprint. As a result, the fire tube industrial boiler market is seeing an increase in market expansion, driven by technological advancements that improve operational efficiency and sustainability.
| Market Scope | |
|---|---|
| Start Year | 2024 |
| Forecast Year | 2025-2034 |
| Start Value | $736.4 Million |
| Forecast Value | $1.01 Billion |
| CAGR | 3.1% |
The 10 MMBTU/hr boiler category is projected to generate USD 250 million by 2034. This particular segment benefits from growing adoption among small and medium-sized industries, particularly those seeking energy-efficient and environmentally friendly solutions. The implementation of stricter emission regulations aimed at reducing carbon footprints also contributes to the demand for more efficient and reliable boilers. Advancements in combustion control, heat exchange design, and material technologies are driving improvements in both the efficiency and reliability of these systems.
The condensing fire tube industrial boiler segment is also expected to experience notable growth, with a projected CAGR of 3% through 2034. This is due to the increasing emphasis on energy efficiency and sustainability within the industrial sector. Condensing boilers, which recover heat from flue gases that would otherwise be wasted, are highly energy-efficient and are preferred by industries for their ability to provide high-temperature heat with precise control. As the demand for oil as a fuel source is expected to rise due to price fluctuations and safety concerns, condensing fire tube boilers will continue to be an attractive option for a wide range of industries.
Germany fire tube industrial boiler market is projected to reach USD 250 million by 2034. Increasing environmental awareness, coupled with corporate sustainability initiatives, is driving the adoption of cleaner and more efficient heating solutions. Stringent government regulations aimed at reducing pollution are leading to the replacement of outdated heating systems, and the enforcement of strict carbon emission standards is accelerating the shift toward modern, eco-friendly solutions. This transition is expected to fuel the continued market growth in the coming years.
Table of Contents
Chapter 1 Methodology & Scope
- 1.1 Market scope & definitions
- 1.2 Market estimates & forecast parameters
- 1.3 Forecast calculation
- 1.4 Data sources
- 1.4.1 Primary
- 1.4.2 Secondary
- 1.4.2.1 Paid
- 1.4.2.2 Public
Chapter 2 Industry Insights
- 2.1 Industry ecosystem analysis
- 2.2 Regulatory landscape
- 2.3 Industry impact forces
- 2.3.1 Growth drivers
- 2.3.2 Industry pitfalls & challenges
- 2.4 Growth potential analysis
- 2.5 Porter's Analysis
- 2.5.1 Bargaining power of suppliers
- 2.5.2 Bargaining power of buyers
- 2.5.3 Threat of new entrants
- 2.5.4 Threat of substitutes
- 2.6 PESTEL Analysis
Chapter 3 Competitive Landscape, 2024
- 3.1 Introduction
- 3.2 Strategic outlook
- 3.3 Innovation & sustainability landscape
Chapter 4 Market Size and Forecast, By Capacity, 2021 – 2034 (Units, MMBTU/hr & USD Million)
- 4.1 Key trends
- 4.2 < 10 MMBTU/hr
- 4.3 10-25 MMBTU/hr
- 4.4 25-50 MMBTU/hr
- 4.5 50-75 MMBTU/hr
- 4.6 > 75 MMBTU/hr
Chapter 5 Market Size and Forecast, By Application, 2021 – 2034 (Units, MMBTU/hr & USD Million)
- 5.1 Key trends
- 5.2 Food processing
- 5.3 Pulp & paper
- 5.4 Chemical
- 5.5 Refinery
- 5.6 Primary metal
- 5.7 Others
Chapter 6 Market Size and Forecast, By Technology, 2021 – 2034 (Units, MMBTU/hr & USD Million)
- 6.1 Key trends
- 6.2 Condensing
- 6.3 Non-condensing
Chapter 7 Market Size and Forecast, By Fuel, 2021 – 2034 (Units, MMBTU/hr & USD Million)
- 7.1 Key trends
- 7.2 Natural gas
- 7.3 Oil
- 7.4 Coal
- 7.5 Others
Chapter 8 Market Size and Forecast, By Country, 2021 – 2034 (Units, MMBTU/hr & USD Million)
- 8.1 Key trends
- 8.2 France
- 8.3 UK
- 8.4 Poland
- 8.5 Italy
- 8.6 Spain
- 8.7 Austria
- 8.8 Germany
- 8.9 Sweden
- 8.10 Russia
Chapter 9 Company Profiles
- 9.1 AC Boilers
- 9.2 Babcock Wanson
- 9.3 Bosch Industriekessel
- 9.4 Cannon Bono Energia
- 9.5 Clayton Industries
- 9.6 Cleaver-Brooks
- 9.7 Forbes Marshall
- 9.8 Fulton
- 9.9 Hoval
- 9.10 Hurst Boiler & Welding
- 9.11 Johnston Boiler
- 9.12 Rentech Boilers
- 9.13 Thermodyne Engineering Systems
- 9.14 Viessmann

