
PUBLISHER: Global Market Insights Inc. | PRODUCT CODE: 1667105

PUBLISHER: Global Market Insights Inc. | PRODUCT CODE: 1667105
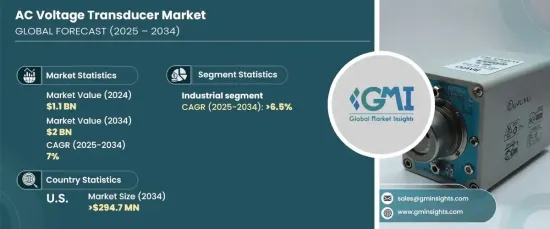
AC Voltage Transducer Market Opportunity, Growth Drivers, Industry Trend Analysis, and Forecast 2025 - 2034
The Global AC Voltage Transducer Market, valued at USD 1.1 billion in 2024, is projected to witness a CAGR of 7% through 2034. This upward trajectory is driven by the rapid adoption of industrial automation and advanced power monitoring systems as industries increasingly prioritize energy efficiency and operational reliability. The market's expansion is further fueled by growing awareness about the critical importance of precise voltage management in energy-intensive sectors like chemical processing, oil and gas, and manufacturing. The need for real-time power monitoring solutions has surged due to stringent regulatory frameworks, the integration of renewable energy sources, and the heightened demand for optimized energy consumption.
The AC voltage transducer market is experiencing a significant transformation thanks to technological advancements that enable the development of compact, highly accurate devices with superior digital integration. Innovations like wireless monitoring and cloud-based solutions are revolutionizing the industry by facilitating the creation of smart transducers. These advanced devices support remote diagnostics and predictive maintenance, offering industries a seamless way to improve operational reliability while reducing maintenance costs. As a result, AC voltage transducers are becoming indispensable across diverse industrial applications, supporting sustainability initiatives and enhancing system performance.
| Market Scope | |
|---|---|
| Start Year | 2024 |
| Forecast Year | 2025-2034 |
| Start Value | $1.1 Billion |
| Forecast Value | $2 Billion |
| CAGR | 7% |
Within the industrial segment, the market is set to grow at a CAGR of 6.5% through 2034. Rising demands for energy-efficient industrial processes and precise voltage regulation are key factors driving this growth. AC voltage transducers play a vital role in safeguarding equipment integrity, optimizing power consumption, and reducing downtime in industries such as manufacturing, oil and gas, and chemical processing. Furthermore, advancements in transducer technology have enabled their seamless integration with IoT systems and real-time monitoring platforms, which significantly enhances their functionality and usability. This integration not only supports automation but also ensures continuous monitoring, making transducers an integral component of modern industrial infrastructure.
The U.S. AC voltage transducer market is expected to generate USD 294.7 million by 2034, owing to the modernization of power infrastructure and the growing adoption of energy-efficient practices. Smart factories across the nation are increasingly incorporating advanced automation, sustainable practices, and energy management systems to enhance productivity and reduce carbon footprints. Moreover, the rise of renewable energy projects such as solar and wind installations underscores the critical need for high-precision voltage monitoring technologies. These solutions play a key role in maintaining grid stability, optimizing energy output, and enhancing overall power management, making them indispensable to the country's transition toward clean energy.
Table of Contents
Chapter 1 Methodology & Scope
- 1.1 Market definitions
- 1.2 Base estimates & calculations
- 1.3 Forecast calculation
- 1.4 Data sources
- 1.4.1 Primary
- 1.4.2 Secondary
- 1.4.2.1 Paid
- 1.4.2.2 Public
Chapter 2 Executive Summary
- 2.1 Industry synopsis, 2021 – 2034
Chapter 3 Industry Insights
- 3.1 Industry ecosystem analysis
- 3.2 Regulatory landscape
- 3.3 Industry impact forces
- 3.3.1 Growth drivers
- 3.3.2 Industry pitfalls & challenges
- 3.4 Growth potential analysis
- 3.5 Porter's analysis
- 3.5.1 Bargaining power of suppliers
- 3.5.2 Bargaining power of buyers
- 3.5.3 Threat of new entrants
- 3.5.4 Threat of substitutes
- 3.6 PESTEL analysis
Chapter 4 Competitive landscape, 2024
- 4.1 Strategic dashboard
- 4.2 Innovation & sustainability landscape
Chapter 5 Market Size and Forecast, By Application, 2021 – 2034 (USD Million)
- 5.1 Key trends
- 5.2 Railway
- 5.3 Renewables
- 5.4 Industrial
- 5.5 Automotive
- 5.6 Others
Chapter 6 Market Size and Forecast, By Region, 2021 – 2034 (USD million)
- 6.1 Key trends
- 6.2 North America
- 6.2.1 U.S.
- 6.2.2 Canada
- 6.2.3 Mexico
- 6.3 Europe
- 6.3.1 UK
- 6.3.2 France
- 6.3.3 Germany
- 6.3.4 Italy
- 6.3.5 Russia
- 6.3.6 Spain
- 6.4 Asia Pacific
- 6.4.1 China
- 6.4.2 Australia
- 6.4.3 India
- 6.4.4 Japan
- 6.4.5 South Korea
- 6.5 Middle East & Africa
- 6.5.1 Saudi Arabia
- 6.5.2 UAE
- 6.5.3 Turkey
- 6.5.4 South Africa
- 6.5.5 Egypt
- 6.6 Latin America
- 6.6.1 Brazil
- 6.6.2 Argentina
Chapter 7 Company Profiles
- 7.1 ABB
- 7.2 Analog Devices
- 7.3 Carlo Gavazzi
- 7.4 CR Magnetics
- 7.5 LEM International
- 7.6 NK Technologies
- 7.7 Phoenix Contact
- 7.8 Schneider Electric
- 7.9 Siemens
- 7.10 Socomec

