
PUBLISHER: Global Market Insights Inc. | PRODUCT CODE: 1666931

PUBLISHER: Global Market Insights Inc. | PRODUCT CODE: 1666931
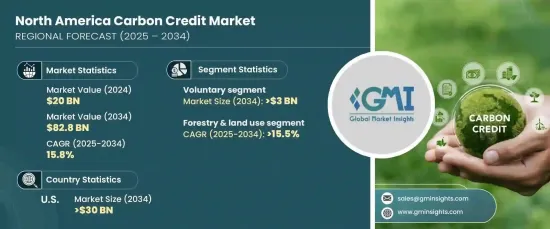
North America Carbon Credit Market Opportunity, Growth Drivers, Industry Trend Analysis, and Forecast 2025 - 2034
North America Carbon Credit Market reached USD 20 billion by 2024 and is estimated to register a CAGR of 15.8% from 2025 to 2034. This market is experiencing rapid growth as businesses incorporate sustainability goals into their operations and increasingly view carbon credits as an essential tool for achieving net-zero emissions. Companies across diverse industries are tapping into both compliance and voluntary carbon markets to offset their carbon footprints, reflecting a more proactive approach to climate responsibility.
A key factor driving this growth is the increasing demand for high-quality, verified carbon credits. This demand is fueling innovation in project development, especially in areas like renewable energy, reforestation, and advanced carbon capture and storage. Moreover, the adoption of digital technologies such as blockchain and artificial intelligence (AI) is enhancing market transparency, improving trading efficiency, and ensuring accurate tracking of credit transactions. Companies are also adopting internal carbon pricing strategies, which help embed the cost of emissions into business decision-making. This shift is encouraging operational improvements and fostering a culture of sustainability within organizations.
| Market Scope | |
|---|---|
| Start Year | 2024 |
| Forecast Year | 2025-2034 |
| Start Value | $20 Billion |
| Forecast Value | $82.8 Billion |
| CAGR | 15.8% |
The voluntary carbon credit market in North America is also set for significant growth, surpassing USD 3 billion by 2034. As businesses place greater importance on sustainability and set ambitious net-zero goals, the voluntary carbon credit sector is gaining momentum. Many companies are using carbon credits to offset their residual emissions, focusing on projects that offer both environmental and social benefits. Nature-based solutions, like reforestation and soil carbon sequestration, are particularly in demand, driving activity within the voluntary carbon credit market.
The forestry and land use sector, particularly afforestation and reforestation projects, is expected to grow at a compound annual growth rate (CAGR) of over 15.5% through 2034. These projects are crucial for capturing carbon while also contributing to biodiversity conservation and ecosystem restoration. By combining carbon sequestration with sustainable land management practices, these projects offer added benefits such as biodiversity preservation and local community development. Their significance as natural climate solutions will help drive overall market growth during the forecast period.
In the U.S., the carbon credit market is expected to surpass USD 30 billion by 2034. This growth is primarily driven by the increasing number of businesses adopting corporate sustainability initiatives and using voluntary carbon credits to meet net-zero commitments. The integration of technologies like blockchain and AI is also enhancing the transparency and efficiency of the market. Furthermore, there is a growing emphasis on the co-benefits of carbon credit projects, such as the conservation of biodiversity and the support of local communities, which are influencing investment decisions and boosting market growth.
Table of Contents
Chapter 1 Methodology & Scope
- 1.1 Market scope & definitions
- 1.2 Market estimates & forecast parameters
- 1.3 Forecast calculation
- 1.4 Data sources
- 1.4.1 Primary
- 1.4.2 Secondary
- 1.4.2.1 Paid
- 1.4.2.2 Public
Chapter 2 Industry Insights
- 2.1 Industry ecosystem analysis
- 2.2 Regulatory landscape
- 2.3 Industry impact forces
- 2.3.1 Growth drivers
- 2.3.2 Industry pitfalls & challenges
- 2.4 Growth potential analysis
- 2.5 Porter's analysis
- 2.5.1 Bargaining power of suppliers
- 2.5.2 Bargaining power of buyers
- 2.5.3 Threat of new entrants
- 2.5.4 Threat of substitutes
- 2.6 PESTEL analysis
Chapter 3 Competitive Landscape, 2024
- 3.1 Introduction
- 3.2 Strategic outlook
- 3.3 Innovation & sustainability landscape
Chapter 4 Market Size and Forecast, By Type, 2021 – 2034 (USD Billion)
- 4.1 Key trends
- 4.2 Voluntary
- 4.3 Compliance
Chapter 5 Market Size and Forecast, By End use, 2021 – 2034 (USD Billion)
- 5.1 Key trends
- 5.2 Agriculture
- 5.3 Carbon capture & storage
- 5.4 Chemical process
- 5.5 Energy efficiency
- 5.6 Industrial
- 5.7 Forestry & land use
- 5.8 Renewable energy
- 5.9 Transportation
- 5.10 Waste management
- 5.11 Others
Chapter 6 Market Size and Forecast, By Country, 2021 – 2034 (USD Billion)
- 6.1 Key trends
- 6.2 U.S.
- 6.3 Canada
- 6.4 Mexico
Chapter 7 Company Profiles
- 7.1 3Degrees
- 7.2 Carbon Collective
- 7.3 Carbon Clean
- 7.4 Climeworks
- 7.5 CarbonCure Technologies
- 7.6 Conservation International
- 7.7 Enel X
- 7.8 Green Mountain Energy
- 7.9 WGL Holdings
- 7.10 Sterling Planet
- 7.11 South Pole
- 7.12 Terrapass
- 7.13 The Nature Conservancy
- 7.14 Xpansiv

