
PUBLISHER: Global Market Insights Inc. | PRODUCT CODE: 1667002

PUBLISHER: Global Market Insights Inc. | PRODUCT CODE: 1667002
Europe Diesel Gensets Market Opportunity, Growth Drivers, Industry Trend Analysis, and Forecast 2025 - 2034
Europe Diesel Gensets Market reached USD 4 billion in 2024 and is set to grow at a robust CAGR of 6.6% from 2025 to 2034. The increasing demand for reliable power sources, driven by growing industrial activities, urbanization, and frequent power disruptions, is fueling the market's expansion. As Europe faces more frequent and severe weather events, such as storms, floods, and wildfires, the need for backup power solutions is more critical than ever. Additionally, the region's burgeoning real estate sector, combined with the ongoing push for energy security and sustainability, will continue to create significant demand for diesel gensets across various industries. Industrial, commercial, and residential sectors are increasingly adopting these solutions to ensure uninterrupted power, especially during grid failures. In this dynamic market, diesel gensets remain a vital option for powering remote areas, providing consistent energy in emergencies, and supporting growth in critical sectors like healthcare, manufacturing, and data centers.
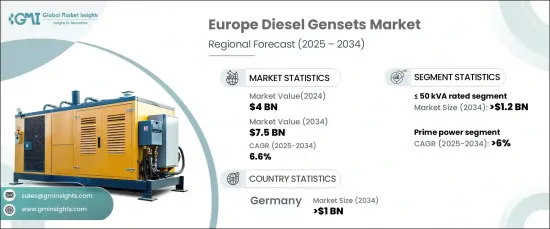
The market for diesel gensets with a rating of <= 50 kVA is expected to generate USD 1.2 billion by 2034. These compact and affordable units are in high demand, primarily driven by the increasing reliance on work-from-home policies and a growing need for dependable power in households and small businesses. With power grid systems under increasing strain, these gensets offer an effective backup during power failures, offering peace of mind to users. The growth in urban and suburban residential areas, as well as the rising frequency of blackouts, will further boost the demand for these smaller gensets, making them a preferred choice in the market.
| Market Scope | |
|---|---|
| Start Year | 2024 |
| Forecast Year | 2025-2034 |
| Start Value | $4 Billion |
| Forecast Value | $7.5 Billion |
| CAGR | 6.6% |
In addition, the prime power diesel genset segment is forecast to grow at a healthy CAGR of 6% through 2034. The demand for these high-capacity generators is being driven by rapid industrialization and the expansion of manufacturing operations, where reliable power is critical for continuous production. These gensets, known for their durability, high efficiency, and long operational lifespan, are in demand in areas with unreliable grid access. As more businesses and commercial establishments turn to diesel gensets for primary power needs, the segment is poised for significant growth. Increased concerns about energy security, alongside the ongoing expansion of commercial infrastructure, will continue to drive the uptake of prime power gensets.
Germany diesel gensets market, a key player in this sector, is expected to generate USD 1 billion by 2034. The growing concerns over power reliability in residential applications and the increasing need for backup power in data centers are major drivers of this market. Data centers, in particular, require uninterrupted power to safeguard critical IT infrastructure and data. As the real estate sector grows and more data centers are developed, the demand for reliable backup power solutions, including diesel gensets, will rise significantly, supporting the market's upward trajectory in Germany and beyond.
Table of Contents
Chapter 1 Methodology & Scope
- 1.1 Market scope & definitions
- 1.2 Market estimates & forecast parameters
- 1.3 Forecast calculation
- 1.4 Data sources
- 1.4.1 Primary
- 1.4.2 Secondary
- 1.4.2.1 Paid
- 1.4.2.2 Public
Chapter 2 Industry Insights
- 2.1 Industry ecosystem analysis
- 2.2 Regulatory landscape
- 2.3 Industry impact forces
- 2.3.1 Growth drivers
- 2.3.2 Industry pitfalls & challenges
- 2.4 Growth potential analysis
- 2.5 Porter's Analysis
- 2.5.1 Bargaining power of suppliers
- 2.5.2 Bargaining power of buyers
- 2.5.3 Threat of new entrants
- 2.5.4 Threat of substitutes
- 2.6 PESTEL Analysis
Chapter 3 Competitive Landscape, 2024
- 3.1 Introduction
- 3.2 Strategic outlook
- 3.3 Innovation & sustainability landscape
Chapter 4 Market Size and Forecast, By Power Rating, 2021 – 2034 ('000 Units & USD Million)
- 4.1 Key trends
- 4.2 ≤ 50 kVA
- 4.3 > 50 kVA - 125 kVA
- 4.4 > 125 kVA - 200 kVA
- 4.5 > 200 kVA - 330 kVA
- 4.6 > 330 kVA - 750 kVA
- 4.7 > 750 kVA
Chapter 5 Market Size and Forecast, By End Use, 2021 – 2034 ('000 Units & USD Million)
- 5.1 Key trends
- 5.2 Residential
- 5.3 Commercial
- 5.4 Industrial
Chapter 6 Market Size and Forecast, By Application, 2021 – 2034 ('000 Units & USD Million)
- 6.1 Key trends
- 6.2 Standby
- 6.3 Peak shaving
- 6.4 Prime/continuous
Chapter 7 Market Size and Forecast, By Country, 2021 – 2034 ('000 Units & USD Million)
- 7.1 Key trends
- 7.2 Russia
- 7.3 UK
- 7.4 Germany
- 7.5 France
- 7.6 Spain
- 7.7 Austria
- 7.8 Italy
Chapter 8 Company Profiles
- 8.1 Ashok Leyland
- 8.2 Atlas Copco AB
- 8.3 Caterpillar
- 8.4 Cummins
- 8.5 FG Wilson
- 8.6 Generac Power Systems
- 8.7 HIMOINSA
- 8.8 J C Bamford Excavators
- 8.9 Rehlko
- 8.10 MAN Energy Solutions
- 8.11 Mikano International
- 8.12 Mitsubishi Heavy Industries
- 8.13 Mitsui E&S Holdings
- 8.14 Prakash
- 8.15 Rolls-Royce
- 8.16 Siemens
- 8.17 Wärtsilä
- 8.18 Yamaha Motor

