
PUBLISHER: Global Market Insights Inc. | PRODUCT CODE: 1667147

PUBLISHER: Global Market Insights Inc. | PRODUCT CODE: 1667147
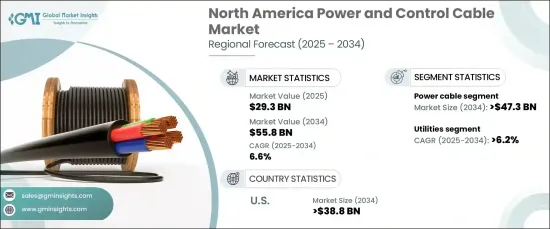
North America Power and Control Cable Market Opportunity, Growth Drivers, Industry Trend Analysis, and Forecast 2025 - 2034
North America Power And Control Cable Market, valued at USD 29.3 billion in 2024, is set to expand at a robust CAGR of 6.6% from 2024 to 2034. This growth is being propelled by the rising demand for reliable energy transmission, significant advancements in industrial automation, and the rapid shift towards renewable energy sources. The ongoing modernization of aging grid infrastructure and increasing investments in smart grid technologies are also key drivers of market expansion. With industries focusing on energy efficiency and sustainability, the role of power and control cables has become indispensable in both conventional and renewable energy systems.
The adoption of renewable energy projects, including solar and wind farms, has further fueled the need for advanced cabling solutions that can withstand modern power systems' rigorous demands. These high-quality cables are essential for ensuring seamless energy transmission and system reliability, particularly as utilities and industries look to upgrade infrastructure. Additionally, rural electrification initiatives and urban grid enhancements are gaining momentum, creating ample opportunities for growth in this sector.
| Market Scope | |
|---|---|
| Start Year | 2024 |
| Forecast Year | 2025-2034 |
| Start Value | $29.3 Billion |
| Forecast Value | $55.8 Billion |
| CAGR | 6.6% |
The market is divided into power cables and control cables, with power cables leading the way. The power cable segment is expected to generate USD 47.3 billion by 2034, driven by increasing energy demand, infrastructure upgrades, and the rapid expansion of renewable energy. Investments in grid modernization and rural electrification are playing a critical role in boosting the adoption of these cables, which are pivotal for connecting renewable energy sites, such as solar and wind farms, to the main grid. Advanced power cables enable efficient energy transmission, enhancing system reliability and reducing energy losses, making them an essential component in energy infrastructure.
By application, the market is segmented into utilities and industries, with the utilities segment projected to grow at a CAGR of 6.2% through 2034. Utilities are prioritizing the replacement of outdated grid systems to enhance energy reliability and accommodate the integration of renewable energy sources. Government-backed projects aimed at improving rural and urban electrification are accelerating the demand for power and control cables, ensuring widespread energy access and supporting renewable energy initiatives.
The United States power and control cable market is expected to generate USD 38.8 billion by 2034. Growth in the region is underpinned by substantial investments in energy infrastructure, renewable energy projects, and the modernization of the national grid. The adoption of smart grid technologies is a significant focus, ensuring efficient energy transmission and bolstering the reliability of power systems. With the continued development of solar and wind energy projects, the demand for durable, high-performance cabling solutions is expected to remain strong, meeting the needs of modern energy networks.
Table of Contents
Chapter 1 Methodology & Scope
- 1.1 Market definitions
- 1.2 Base estimates & calculations
- 1.3 Forecast calculation
- 1.4 Data sources
- 1.4.1 Primary
- 1.4.2 Secondary
- 1.4.2.1 Paid
- 1.4.2.2 Public
Chapter 2 Industry Insights
- 2.1 Industry ecosystem analysis
- 2.2 Regulatory landscape
- 2.3 Industry impact forces
- 2.3.1 Growth drivers
- 2.3.2 Industry pitfalls & challenges
- 2.4 Growth potential analysis
- 2.5 Porter's analysis
- 2.5.1 Bargaining power of suppliers
- 2.5.2 Bargaining power of buyers
- 2.5.3 Threat of new entrants
- 2.5.4 Threat of substitutes
- 2.6 PESTEL analysis
Chapter 3 Competitive landscape, 2024
- 3.1 Strategic dashboard
- 3.2 Innovation & sustainability landscape
Chapter 4 Market Size and Forecast, By Product, 2021 – 2034 (USD Million)
- 4.1 Key trends
- 4.2 Power cable
- 4.3 Control cable
Chapter 5 Market Size and Forecast, By Voltage, 2021 – 2034 (USD Million)
- 5.1 Key trends
- 5.2 Low voltage
- 5.2.1 LV power cable
- 5.2.2 LV control cable
- 5.3 Medium voltage
- 5.4 High voltage
Chapter 6 Market Size and Forecast, By Application, 2021 – 2034 (USD Million)
- 6.1 Key trends
- 6.2 Utilities
- 6.3 Industries
- 6.3.1 Power plants
- 6.3.2 Oil & gas
- 6.3.3 Cement
- 6.3.4 Others
Chapter 7 Market Size and Forecast, By Country, 2021 – 2034 (USD Million)
- 7.1 Key trends
- 7.2 U.S.
- 7.3 Canada
- 7.4 Mexico
Chapter 8 Company Profiles
- 8.1 Belden
- 8.2 Bergen Cable Technology
- 8.3 Ducab
- 8.4 Encore Wire Corporation
- 8.5 Furukawa Electric
- 8.6 KEC International
- 8.7 Klaus Faber
- 8.8 LS Cable & System
- 8.9 Marmon Holdings
- 8.10 Nexans
- 8.11 NKT
- 8.12 Prysmian Group
- 8.13 Southwire Company
- 8.14 Sumitomo Electric Industries
- 8.15 TPC Wire & Cable
- 8.16 The Okonite Company

