
PUBLISHER: Global Market Insights Inc. | PRODUCT CODE: 1667065

PUBLISHER: Global Market Insights Inc. | PRODUCT CODE: 1667065
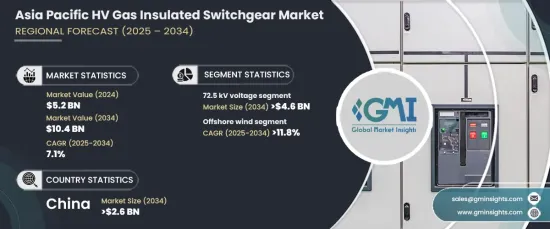
Asia Pacific HV Gas Insulated Switchgear Market Opportunity, Growth Drivers, Industry Trend Analysis, and Forecast 2025 - 2034
Asia Pacific HV Gas Insulated Switchgear Market reached USD 5.2 billion in 2024 and is expected to grow at a robust CAGR of 7.1% from 2025 to 2034. This growth is driven by the rising demand for electricity, rapid industrialization, and extensive urban development across the region. Governments are making substantial investments in upgrading grid infrastructure to meet the increasing energy requirements, creating a conducive environment for GIS adoption. The compact design, enhanced reliability, and superior safety features of GIS make it an ideal choice for urban spaces where land is scarce.
In addition, ongoing technological advancements, including eco-friendly alternatives to traditional materials, are contributing to the market's expansion. As nations shift towards renewable energy and emphasize sustainability, the demand for efficient transmission solutions like GIS continues to rise. The need for better cross-border transmission networks, coupled with a focus on minimizing energy losses and maximizing efficiency, is further boosting market growth. Government-backed programs aimed at modernizing power grids are opening new opportunities for GIS technology, especially in regions focused on upgrading their energy systems.
| Market Scope | |
|---|---|
| Start Year | 2024 |
| Forecast Year | 2025-2034 |
| Start Value | $5.2 Billion |
| Forecast Value | $10.4 Billion |
| CAGR | 7.1% |
In terms of voltage capacity, the 72.5 kV segment is expected to reach over USD 4.6 billion by 2034. This segment is favored for its ability to provide compact and reliable power distribution, making it suitable for densely populated urban and industrial environments. Its space-efficient design helps optimize land usage in regions with high population density, while the integration of renewable energy sources like wind and solar power further drives demand for advanced switchgear solutions.
The offshore wind sector is seeing rapid expansion, with the market projected to grow at a CAGR of more than 11.8% through 2034. As nations boost their renewable energy capacity, the need for efficient power transmission from offshore wind farms to the main grid becomes crucial. GIS systems are well-suited for these applications, offering durability and reliability in harsh marine conditions. With their small footprint and effectiveness in offshore environments, GIS ensures that energy transmission remains efficient and stable.
China is leading the way in this market, with its GIS sector projected to exceed USD 2.6 billion by 2034. The country is heavily investing in smart grid technologies and the integration of renewable energy to enhance grid stability, address growing energy demand, and reduce carbon emissions. The adoption of GIS solutions is expected to rise as part of China's large-scale efforts to modernize its power grids and ensure dependable energy distribution nationwide.
Table of Contents
Chapter 1 Methodology & Scope
- 1.1 Market definitions
- 1.2 Base estimates & calculations
- 1.3 Forecast calculation
- 1.4 Data sources
- 1.4.1 Primary
- 1.4.2 Secondary
- 1.4.2.1 Paid
- 1.4.2.2 Public
Chapter 2 Industry Insights
- 2.1 Industry ecosystem analysis
- 2.2 Regulatory landscape
- 2.3 Industry impact forces
- 2.3.1 Growth drivers
- 2.3.2 Industry pitfalls & challenges
- 2.4 Growth potential analysis
- 2.5 Porter's analysis
- 2.5.1 Bargaining power of suppliers
- 2.5.2 Bargaining power of buyers
- 2.5.3 Threat of new entrants
- 2.5.4 Threat of substitutes
- 2.6 PESTEL analysis
Chapter 3 Competitive landscape, 2024
- 3.1 Strategic dashboard
- 3.2 Innovation & sustainability landscape
Chapter 4 Market Size and Forecast, By Capacity, 2021 – 2034 (USD Million, Units)
- 4.1 Key trends
- 4.2 72.5 kV
- 4.3 145 kV
- 4.4 245 kV
- 4.5 275 kV
- 4.6 300 kV
- 4.7 400 kV
- 4.8 500 kV
- 4.9 765 kV
Chapter 5 Market Size and Forecast, By Application, 2021 – 2034 (USD Million, Units)
- 5.1 Key trends
- 5.2 Offshore Wind
- 5.3 Others
Chapter 6 Market Size and Forecast, By Country, 2021 – 2034 (USD Million, Units)
- 6.1 Key trends
- 6.2 China
- 6.3 Japan
- 6.4 South Korea
- 6.5 India
- 6.6 Australia
Chapter 7 Company Profiles
- 7.1 ABB
- 7.2 Bharat Heavy Electricals
- 7.3 CG Power and Industrial Solutions
- 7.4 E + I Engineering
- 7.5 Eaton
- 7.6 Fuji Electric
- 7.7 General Electric
- 7.8 HD Hyundai Electric
- 7.9 Hitachi
- 7.10 Hyosung Heavy Industries
- 7.11 Lucy Group
- 7.12 Mitsubishi Electric
- 7.13 Ormazabal
- 7.14 Schneider Electric
- 7.15 Siemens
- 7.16 Skema
- 7.17 Toshiba

