
PUBLISHER: Global Market Insights Inc. | PRODUCT CODE: 1666667

PUBLISHER: Global Market Insights Inc. | PRODUCT CODE: 1666667
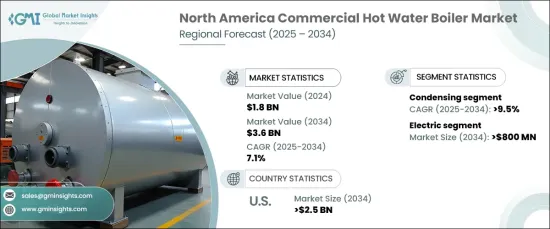
North America Commercial Hot Water Boiler Market Opportunity, Growth Drivers, Industry Trend Analysis, and Forecast 2025 - 2034
North America Commercial Hot Water Boiler Market, valued at USD 1.8 billion in 2024, is projected to grow at a CAGR of 7.1% from 2025 to 2034. The region's robust economic growth and stable infrastructure development are key drivers of this expansion. The rising demand for advanced heating solutions in various commercial sectors is expected to further boost market growth over the forecast period.
Commercial hot water boilers are high-performance heating systems designed to provide a continuous supply of hot water for diverse applications in commercial spaces. These systems are more powerful than standard water heaters, enabling them to meet the needs of larger establishments such as businesses, institutions, and industrial facilities. The ongoing adoption of energy-efficient technologies and the increasing emphasis on sustainability in construction practices are anticipated to play a significant role in propelling the market forward.
| Market Scope | |
|---|---|
| Start Year | 2024 |
| Forecast Year | 2025-2034 |
| Start Value | $1.8 Billion |
| Forecast Value | $3.6 Billion |
| CAGR | 7.1% |
The electric commercial hot water boiler segment is forecasted to surpass USD 800 million by 2034. This growth is largely attributed to heightened environmental awareness and the enforcement of stringent government policies promoting cleaner energy solutions. These boilers are recognized for their superior energy efficiency, ease of replacement, and compatibility with advanced heating technologies like condensing systems, which are becoming a preferred choice for retrofitting older units.
Condensing commercial hot water boilers are expected to experience remarkable growth, with a projected CAGR exceeding 9.5% through 2034. These systems utilize heat from exhaust gases to improve energy efficiency and reduce operational costs. Growing demand for sustainable energy solutions and regulatory measures aimed at lowering carbon emissions are driving their adoption in commercial applications. These boilers align with the global push for cleaner energy alternatives and offer businesses an opportunity to reduce their environmental impact.
The healthcare sector represents a significant area of application for commercial hot water boilers. These systems are used for various purposes, including steam production, sterilizing medical equipment, heating water for laundry, and supporting humidification systems. Additionally, maintaining optimal indoor temperatures for patient and staff comfort during colder months contributes to the growing adoption of these boilers in healthcare facilities.
In the United States, the commercial hot water boiler market is poised to exceed USD 2.5 billion by 2034. Factors such as increased urbanization, investments in commercial infrastructure, and supportive government policies promoting clean energy adoption are expected to drive market expansion. Enhanced focus on reducing emissions and improving air quality will also play a crucial role in shaping industry growth.
Table of Contents
Chapter 1 Methodology & Scope
- 1.1 Market scope & definitions
- 1.2 Market estimates & forecast parameters
- 1.3 Forecast calculation
- 1.4 Data sources
- 1.4.1 Primary
- 1.4.2 Secondary
- 1.4.2.1 Paid
- 1.4.2.2 Public
Chapter 2 Industry Insights
- 2.1 Industry ecosystem analysis
- 2.2 Regulatory landscape
- 2.3 Industry impact forces
- 2.3.1 Growth drivers
- 2.3.2 Industry pitfalls & challenges
- 2.4 Growth potential analysis
- 2.5 Porter's analysis
- 2.5.1 Bargaining power of suppliers
- 2.5.2 Bargaining power of buyers
- 2.5.3 Threat of new entrants
- 2.5.4 Threat of substitutes
- 2.6 PESTEL analysis
Chapter 3 Competitive Landscape, 2024
- 3.1 Introduction
- 3.2 Strategic outlook
- 3.3 Innovation & sustainability landscape
Chapter 4 Market Size and Forecast, By Fuel, 2021 – 2034 (Units, MMBTU/hr & USD Million)
- 4.1 Key trends
- 4.2 Natural gas
- 4.3 Oil
- 4.4 Coal
- 4.5 Electric
- 4.6 Others
Chapter 5 Market Size and Forecast, By Capacity, 2021 – 2034 (Units, MMBTU/hr & USD Million)
- 5.1 Key trends
- 5.2 ≤ 0.3 - 2.5 MMBTU/hr
- 5.3 > 2.5 - 10 MMBTU/hr
- 5.4 > 10 - 25 MMBTU/hr
- 5.5 > 25 - 50 MMBTU/hr
- 5.6 > 50 MMBtu/hr
Chapter 6 Market Size and Forecast, By Technology, 2021 – 2034 (Units, MMBTU/hr & USD Million)
- 6.1 Key trends
- 6.2 Condensing
- 6.3 Non-condensing
Chapter 7 Market Size and Forecast, By Application, 2021 – 2034 (Units, MMBTU/hr & USD Million)
- 7.1 Key trends
- 7.2 Offices
- 7.3 Healthcare facilities
- 7.4 Educational institutions
- 7.5 Lodgings
- 7.6 Retail stores
- 7.7 Others
Chapter 8 Market Size and Forecast, By Country, 2021 – 2034 (Units, MMBTU/hr & USD Million)
- 8.1 Key trends
- 8.2 U.S.
- 8.3 Canada
- 8.4 Mexico
Chapter 9 Company Profiles
- 9.1 A.O. Smith
- 9.2 AERCO International
- 9.3 American Water Heaters
- 9.4 Bosch Industriekessel
- 9.5 Bradford White Corporation
- 9.6 Burnham Commercial
- 9.7 Cleaver-Brooks
- 9.8 Columbia Boiler Company
- 9.9 Ferroli
- 9.10 Laars Heating Systems
- 9.11 Lochinvar
- 9.12 Parker Boiler
- 9.13 Patterson-Kelley
- 9.14 Raypak
- 9.15 Rheem Manufacturing Company
- 9.16 Thermal Solutions
- 9.17 Viessmann
- 9.18 Weil-McLain

