
PUBLISHER: Global Market Insights Inc. | PRODUCT CODE: 1685139

PUBLISHER: Global Market Insights Inc. | PRODUCT CODE: 1685139
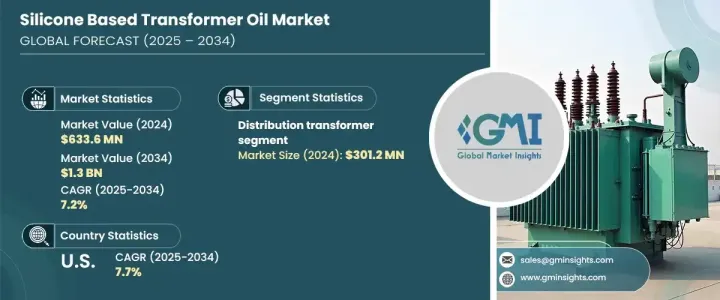
Silicone Based Transformer Oil Market Opportunity, Growth Drivers, Industry Trend Analysis, and Forecast 2025 - 2034
The Global Silicone Based Transformer Oil Market was valued at USD 633.6 million in 2024 and is projected to experience a CAGR of 7.2% from 2025 to 2034. This growth is largely driven by the increasing demand for advanced electrical insulation fluids, with a focus on enhancing grid reliability, boosting energy efficiency, and fostering sustainability. As the global power grid faces mounting pressure to support both traditional and renewable energy sources, the need for modern, high-performance transformer oils becomes more urgent.
Silicone-based oils stand out due to their exceptional properties, including superior dielectric strength, high-temperature resistance, and eco-friendly characteristics, making them ideal for the growing demand for safer and more efficient electrical systems. Additionally, the increasing integration of renewable energy and the need to replace aging infrastructure are creating a perfect storm for silicone-based oils, positioning them as a key component in the modernization of global power grids.
| Market Scope | |
|---|---|
| Start Year | 2024 |
| Forecast Year | 2025-2034 |
| Start Value | $633.6 Million |
| Forecast Value | $1.3 Billion |
| CAGR | 7.2% |
The distribution transformer segment dominated the market in 2024, accounting for USD 301.2 million, and is projected to continue growing at a 7.5% CAGR throughout the forecast period. The demand for silicone-based transformer oils in distribution transformers is driven by the escalating need for more reliable and efficient electrical distribution systems fueled by rapid urbanization and industrial expansion. These oils are favored for their high performance, ensuring the longevity and durability of transformers under demanding conditions. Furthermore, as industries place greater emphasis on sustainability, silicone-based oils are gaining popularity due to their biodegradability and lower environmental impact compared to traditional oils.
In the U.S., the silicone-based transformer oil market reached USD 151.1 million in 2024, with an anticipated CAGR of 7.7% from 2025 to 2034. This market expansion is propelled by accelerated urban and industrial development, which has spurred significant investments in electrical infrastructure to meet the growing energy demands. The introduction of stringent environmental regulations, particularly in regions such as Asia, is driving the adoption of fire-resistant and environmentally friendly transformer oils, including silicone-based oils. Additionally, the ongoing grid modernization efforts and the push for smart grid technologies are increasing the demand for these advanced insulating fluids.
The silicone-based transformer oil market is firmly positioned for steady growth as it continues to meet the increasing demand for energy-efficient solutions that align with global sustainability objectives. Known for their remarkable performance, enhanced safety features, and minimal environmental impact, silicone-based transformer oils are becoming integral to the modernization and reliability of power systems worldwide. As the need for renewable energy integration and infrastructure updates intensifies, the market is set to experience consistent demand across key global regions.
Table of Contents
Chapter 1 Methodology & Scope
- 1.1 Market scope & definitions
- 1.2 Base estimates & calculations
- 1.3 Forecast calculations
- 1.4 Data sources
- 1.4.1 Primary
- 1.4.2 Secondary
- 1.4.2.1 Paid sources
- 1.4.2.2 Public sources
Chapter 2 Executive Summary
- 2.1 Industry synopsis, 2021-2034
Chapter 3 Industry Insights
- 3.1 Industry ecosystem analysis
- 3.1.1 Factor affecting the value chain
- 3.1.2 Profit margin analysis
- 3.1.3 Disruptions
- 3.1.4 Future outlook
- 3.1.5 Manufacturers
- 3.1.6 Distributors
- 3.2 Supplier landscape
- 3.3 Profit margin analysis
- 3.4 Key news & initiatives
- 3.5 Regulatory landscape
- 3.6 Impact forces
- 3.6.1 Growth drivers
- 3.6.1.1 Refurbishment of existing grid networks
- 3.6.1.2 Rising electric infrastructure spending
- 3.6.1.3 Rapid smart grid adoption
- 3.6.1.4 Expansion of sustainable electricity networks
- 3.6.1.5 Increasing demand for electricity
- 3.6.1.6 Large scale renewable integration
- 3.6.1.7 Increasing demand for sustainable electrical networks
- 3.6.2 Industry pitfalls & challenges
- 3.6.2.1 Increasing adoption of alternate transformer technologies
- 3.6.1 Growth drivers
- 3.7 Growth potential analysis
- 3.8 Porter’s analysis
- 3.9 PESTEL analysis
Chapter 4 Competitive Landscape, 2024
- 4.1 Introduction
- 4.2 Company market share analysis
- 4.3 Competitive positioning matrix
- 4.4 Strategic outlook matrix
Chapter 5 Market Estimates & Forecast, By Application, 2021-2034 (USD Million) (Tons)
- 5.1 Key trends
- 5.2 Distribution transformer
- 5.3 Power transformer
- 5.4 Instrument transformer
- 5.5 Others
Chapter 6 Market Estimates & Forecast, By Region, 2021-2034 (USD Million) (Tons)
- 6.1 Key trends
- 6.2 North America
- 6.2.1 U.S.
- 6.2.2 Canada
- 6.3 Europe
- 6.3.1 UK
- 6.3.2 Germany
- 6.3.3 France
- 6.3.4 Italy
- 6.3.5 Spain
- 6.3.6 Russia
- 6.4 Asia Pacific
- 6.4.1 China
- 6.4.2 India
- 6.4.3 Japan
- 6.4.4 South Korea
- 6.4.5 Australia
- 6.5 Latin America
- 6.5.1 Brazil
- 6.5.2 Mexico
- 6.6 MEA
- 6.6.1 South Africa
- 6.6.2 Saudi Arabia
- 6.6.3 UAE
Chapter 7 Company Profiles
- 7.1 Aevitas
- 7.2 Antala
- 7.3 BENZOIL
- 7.4 Cargill, Incorporated
- 7.5 Changzhou Juyou New Material Tech
- 7.6 Clearco Products
- 7.7 Dow
- 7.8 DRP Silicone
- 7.9 Eden Transformer Oil
- 7.10 JIT Silicones Plus
- 7.11 Midwest Lubricants
- 7.12 Supreme Chemicals
- 7.13 Supreme Silicones India

