
PUBLISHER: Global Market Insights Inc. | PRODUCT CODE: 1667040

PUBLISHER: Global Market Insights Inc. | PRODUCT CODE: 1667040
Asia Pacific Vacuum Insulated Switchgear Market Opportunity, Growth Drivers, Industry Trend Analysis, and Forecast 2025 - 2034
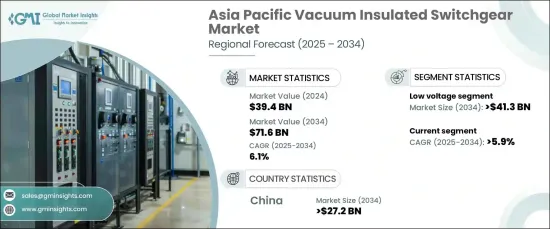
Asia Pacific Vacuum Insulated Switchgear Market reached USD 39.4 billion in 2024 and is projected to grow at a robust CAGR of 6.1% between 2025 and 2034. This growth is fueled by surging demand for reliable and efficient electrical systems across diverse industries, including power generation, manufacturing, and distribution. Governments across the region are implementing initiatives to improve energy efficiency and lower carbon emissions, propelling the adoption of advanced switchgear solutions.
The ongoing transition to renewable energy projects and the deployment of smart grid technologies are significantly contributing to the market's upward trajectory. Additionally, increasing investments in electrical infrastructure, coupled with innovations in cost-effective and compact systems, are further enhancing market potential. Rising urbanization and industrialization across emerging economies in the region are creating substantial opportunities for market players to expand their footprint.
| Market Scope | |
|---|---|
| Start Year | 2024 |
| Forecast Year | 2025-2034 |
| Start Value | $39.4 Billion |
| Forecast Value | $71.6 Billion |
| CAGR | 6.1% |
The low voltage segment is poised to reach USD 41.3 billion by 2034, driven by increasing demand for compact and energy-efficient switchgear systems, particularly in residential and commercial sectors. Emerging economies in Asia Pacific are focusing on modernizing electrical infrastructure to meet the growing need for reliable and safe energy solutions. The adoption of renewable energy sources and automation in electrical systems is further boosting demand for low-voltage vacuum-insulated switchgear. These systems are becoming integral to sustainable energy practices, supporting the integration of wind, solar, and other renewable energy sources into the grid.
Industrial applications are also witnessing a surge in vacuum-insulated switchgear adoption, with the segment expected to grow at a CAGR of 5.9% through 2034. Rapid industrialization and the expansion of the energy and power sectors across the Asia Pacific region are key drivers for this growth. Industries are prioritizing compact, reliable, and high-performance electrical solutions to ensure operational efficiency and safety. The growing deployment of renewable energy projects, such as wind and solar farms, is further accelerating the need for advanced switchgear to enhance grid stability and safety.
China is projected to lead the regional market, generating USD 27.2 billion by 2034. The country's emphasis on modernizing its power grid and implementing smart grid technologies is driving demand for high-performance and space-efficient vacuum-insulated switchgear. With rapid growth in industrial and urban sectors, China is expanding its power transmission and distribution networks, creating significant opportunities for switchgear manufacturers. The reliability and ability of vacuum-insulated switchgear to operate under extreme conditions make it a preferred choice, aligning seamlessly with China's ambitious infrastructure and sustainability goals.
Table of Contents
Chapter 1 Methodology & Scope
- 1.1 Market definitions
- 1.2 Base estimates & calculations
- 1.3 Forecast calculation
- 1.4 Data sources
- 1.4.1 Primary
- 1.4.2 Secondary
- 1.4.2.1 Paid
- 1.4.2.2 Public
Chapter 2 Industry Insights
- 2.1 Industry ecosystem analysis
- 2.2 Regulatory landscape
- 2.3 Industry impact forces
- 2.3.1 Growth drivers
- 2.3.2 Industry pitfalls & challenges
- 2.4 Growth potential analysis
- 2.5 Porter's analysis
- 2.5.1 Bargaining power of suppliers
- 2.5.2 Bargaining power of buyers
- 2.5.3 Threat of new entrants
- 2.5.4 Threat of substitutes
- 2.6 PESTEL analysis
Chapter 3 Competitive landscape, 2024
- 3.1 Strategic dashboard
- 3.2 Innovation & sustainability landscape
Chapter 4 Market Size and Forecast, By Voltage, 2021 – 2034 (USD Million, ‘000 Units)
- 4.1 Key trends
- 4.2 Low
- 4.3 Medium
- 4.4 High
Chapter 5 Market Size and Forecast, By Current, 2021 – 2034 (USD Million, ‘000 Units)
- 5.1 Key trends
- 5.2 AC
- 5.3 DC
Chapter 6 Market Size and Forecast, By Application, 2021 – 2034 (USD Million, ‘000 Units)
- 6.1 Key trends
- 6.2 Residential
- 6.3 Commercial & Industrial
- 6.4 Utility
Chapter 7 Market Size and Forecast, By Country, 2021 – 2034 (USD Million, ‘000 Units)
- 7.1 Key trends
- 7.2 China
- 7.3 Japan
- 7.4 South Korea
- 7.5 India
- 7.6 Australia
Chapter 8 Company Profiles
- 8.1 ABB
- 8.2 Bharat Heavy Electricals
- 8.3 CG Power and Industrial Solutions
- 8.4 E + I Engineering
- 8.5 Eaton
- 8.6 Fuji Electric
- 8.7 General Electric
- 8.8 HD Hyundai Electric
- 8.9 Hitachi
- 8.10 Hyosung Heavy Industries
- 8.11 Lucy Group
- 8.12 Mitsubishi Electric
- 8.13 Ormazabal
- 8.14 Schneider Electric
- 8.15 Siemens
- 8.16 Skema
- 8.17 Toshiba

