
PUBLISHER: Global Market Insights Inc. | PRODUCT CODE: 1684823

PUBLISHER: Global Market Insights Inc. | PRODUCT CODE: 1684823
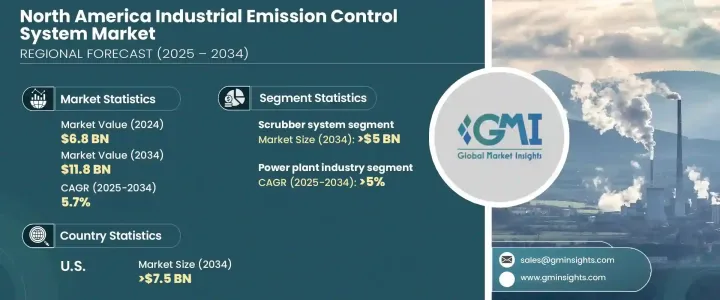
North America Industrial Emission Control System Market Opportunity, Growth Drivers, Industry Trend Analysis, and Forecast 2025 - 2034
North America Industrial Emission Control System Market, valued at USD 6.8 billion in 2024, is expected to grow at a CAGR of 5.7% between 2025 and 2034. This growth is primarily driven by increasing environmental concerns, stringent regulatory requirements, and significant advancements in emission control technologies. As industries continue to place a greater emphasis on sustainability and compliance with environmental regulations, the adoption of advanced emission control systems is gaining momentum across the region. The shift towards greener and more energy-efficient technologies is evident across key sectors, with industries proactively reducing their environmental impact while adhering to stringent government mandates.
Innovations such as real-time monitoring systems, energy-saving technologies, and automated solutions are further enhancing the efficiency and effectiveness of these emission control systems. As the demand for cleaner air intensifies, companies are increasingly investing in state-of-the-art technologies to meet sustainability goals and maintain compliance with evolving environmental standards. This growing trend of adopting advanced emission control technologies will continue to fuel market growth over the next decade.
| Market Scope | |
|---|---|
| Start Year | 2024 |
| Forecast Year | 2025-2034 |
| Start Value | $6.8 Billion |
| Forecast Value | $11.8 Billion |
| CAGR | 5.7% |
The scrubber systems segment is projected to reach USD 5 billion by 2034. This surge in demand is attributed to the concerted efforts by industrial leaders to tackle oil mist emissions and to implement advanced dust collection technologies. With manufacturers constantly innovating to improve the design and efficiency of scrubber systems, market penetration is expanding rapidly. Additionally, there is a growing recognition of the economic advantages associated with emission reduction, such as enhanced energy efficiency and reduced regulatory penalties. These factors are driving increased investments in advanced scrubber systems, further strengthening their market position.
The power plant segment is expected to grow at a CAGR of 5% through 2034, driven by the increased focus on emission reduction and rising investments in power generation infrastructure. Power plants are prioritizing emission control systems that not only comply with regulatory standards but also contribute to overall sustainability goals. The industry's emphasis on reducing harmful emissions like sulfur oxides (SOx) and nitrogen oxides (NOx) has led to the widespread adoption of innovative solutions, particularly in regions with strict environmental regulations.
In the U.S., the industrial emission control system market is set to generate USD 7.5 billion by 2034. This robust growth is being driven by stricter environmental regulations and a heightened focus on improving air quality. The demand for advanced technologies to control pollutants such as SOx, NOx, and particulate matter is rising across various sectors, including power generation, cement, and chemicals. Innovations in filtration, scrubbing, and catalytic reduction are gaining significant traction, offering improved operational efficiency and ensuring businesses meet evolving regulatory requirements. As industries invest in efficient emission control solutions to reduce their environmental footprint, the market presents substantial opportunities for growth.
Table of Contents
Chapter 1 Methodology & Scope
- 1.1 Market scope & definitions
- 1.2 Market estimates & forecast parameters
- 1.3 Forecast calculation
- 1.4 Data sources
- 1.4.1 Primary
- 1.4.2 Secondary
- 1.4.2.1 Paid
- 1.4.2.2 Public
Chapter 2 Industry Insights
- 2.1 Industry ecosystem analysis
- 2.2 Regulatory landscape
- 2.3 Industry impact forces
- 2.3.1 Growth drivers
- 2.3.2 Industry pitfalls & challenges
- 2.4 Growth potential analysis
- 2.5 Porter's analysis
- 2.5.1 Bargaining power of suppliers
- 2.5.2 Bargaining power of buyers
- 2.5.3 Threat of new entrants
- 2.5.4 Threat of substitutes
- 2.6 PESTEL analysis
Chapter 3 Competitive Landscape, 2024
- 3.1 Introduction
- 3.2 Strategic outlook
- 3.3 Innovation & sustainability landscape
Chapter 4 Market Size and Forecast, By System, 2021 – 2034 (USD Billion)
- 4.1 Key trends
- 4.2 Electrostatic precipitators
- 4.3 Catalytic systems
- 4.4 Absorbers
- 4.5 Scrubbers
- 4.6 Others
Chapter 5 Market Size and Forecast, By Industry, 2021 – 2034 (USD Billion)
- 5.1 Key trends
- 5.2 Power plants
- 5.3 Chemical & petrochemical
- 5.4 Cement
- 5.5 Metal
- 5.6 Manufacturing
- 5.7 Others
Chapter 6 Market Size and Forecast, By Country, 2021 – 2034 (USD Billion)
- 6.1 Key trends
- 6.2 U.S.
- 6.3 Canada
- 6.4 Mexico
Chapter 7 Company Profiles
- 7.1 Babcock & Wilcox
- 7.2 BASF
- 7.3 CECO Environmental
- 7.4 Durr Group
- 7.5 FLSmidth
- 7.6 Fuel Tech
- 7.7 GEA Group
- 7.8 General Electric
- 7.9 Hamon
- 7.10 Mitsubishi Heavy Industries
- 7.11 Monroe Environmental
- 7.12 Thermax

