
PUBLISHER: Global Market Insights Inc. | PRODUCT CODE: 1667027

PUBLISHER: Global Market Insights Inc. | PRODUCT CODE: 1667027
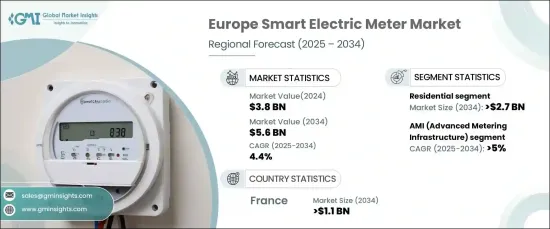
Europe Smart Electric Meter Market Opportunity, Growth Drivers, Industry Trend Analysis, and Forecast 2025 - 2034
Europe Smart Electric Meter Market reached a valuation of USD 3.8 billion in 2024 and is projected to experience a CAGR of 4.4% from 2025 to 2034. This growth trajectory is fueled by the region's relentless pursuit of modernizing its energy infrastructure and meeting ambitious energy efficiency targets. Countries across Europe, including France, are investing heavily in smart grid solutions to enhance the overall performance and reliability of their electricity systems. With a strong focus on sustainability, smart meters have become a pivotal component in achieving these objectives, driving increased adoption across the continent.
In recent years, the European Union has emphasized the importance of smart technologies to transform the traditional energy landscape. Smart meters are central to this transformation, offering real-time monitoring capabilities and advanced features that enhance both efficiency and accuracy. By enabling more precise billing, these devices empower consumers to manage their energy usage more effectively, contributing to a reduction in waste and promoting greener practices. Furthermore, they play a crucial role in incorporating renewable energy sources into the grid, ensuring a balanced and sustainable energy supply.
| Market Scope | |
|---|---|
| Start Year | 2024 |
| Forecast Year | 2025-2034 |
| Start Value | $3.8 Billion |
| Forecast Value | $5.6 Billion |
| CAGR | 4.4% |
The rise of smart metering technology is transforming how energy is distributed and consumed. These meters provide granular insights into electricity usage, allowing for better load management and optimization of energy consumption. With features like automated billing and demand response programs, they enable utilities to respond swiftly to changes in energy needs, supporting a more resilient and adaptable energy ecosystem. This shift is not only aligned with European Union directives but also resonates with national strategies aimed at reducing carbon emissions and fostering a more sustainable future.
Governments across Europe are actively supporting the adoption of smart meters by introducing regulatory frameworks and offering incentives. These efforts are geared towards accelerating the deployment of advanced metering solutions essential for modernizing the region's energy infrastructure. The emphasis on smart grids is not just about efficiency; it's about building a more intelligent, interconnected system that can handle the demands of a rapidly evolving energy sector. As the market for smart electric meters continues to grow, it presents numerous opportunities for innovation and the advancement of smart technology in Europe's energy landscape.
Table of Contents
Chapter 1 Methodology & Scope
- 1.1 Market definitions
- 1.2 Base estimates & calculations
- 1.3 Forecast calculation
- 1.4 Data sources
- 1.4.1 Primary
- 1.4.2 Secondary
- 1.4.2.1 Paid
- 1.4.2.2 Public
Chapter 2 Industry Insights
- 2.1 Industry ecosystem analysis
- 2.2 Regulatory landscape
- 2.3 Industry impact forces
- 2.3.1 Growth drivers
- 2.3.2 Industry pitfalls & challenges
- 2.4 Growth potential analysis
- 2.5 Porter's analysis
- 2.5.1 Bargaining power of suppliers
- 2.5.2 Bargaining power of buyers
- 2.5.3 Threat of new entrants
- 2.5.4 Threat of substitutes
- 2.6 PESTEL analysis
Chapter 3 Competitive landscape, 2024
- 3.1 Strategic dashboard
- 3.2 Innovation & sustainability landscape
Chapter 4 Market Size and Forecast, By Application, 2021 – 2034 (USD Million, ‘000 Units)
- 4.1 Key trends
- 4.2 Residential
- 4.2.1 Single family
- 4.2.2 Multi family
- 4.3 Commercial
- 4.3.1 Education
- 4.3.2 Healthcare
- 4.3.3 Retail
- 4.3.4 Logistics & Transportation
- 4.3.5 Offices
- 4.3.6 Hospitality
- 4.3.7 Others
- 4.4 Utility
Chapter 5 Market Size and Forecast, By Technology, 2021 – 2034 (USD Million, ‘000 Units)
- 5.1 Key trends
- 5.2 AMI
- 5.2.1 RF
- 5.2.2 PLC
- 5.2.3 Cellular
- 5.3 AMR
Chapter 6 Market Size and Forecast, By Phase, 2021 – 2034 (USD Million, ‘000 Units)
- 6.1 Key trends
- 6.2 Single
- 6.3 Three
Chapter 7 Market Size and Forecast, By Country, 2021 – 2034 (USD Million, ‘000 Units)
- 7.1 Key trends
- 7.2 UK
- 7.3 France
- 7.4 Germany
- 7.5 Italy
- 7.6 Russia
- 7.7 Spain
Chapter 8 Company Profiles
- 8.1 Aclara Technologies LLC
- 8.2 Apator SA
- 8.3 Circutor
- 8.4 Cisco Systems, Inc.
- 8.5 CyanConnode
- 8.6 General Electric
- 8.7 Holley Technology Ltd.
- 8.8 Honeywell International Inc
- 8.9 Iskraemeco Group
- 8.10 Itron Inc.
- 8.11 Jabil Inc.
- 8.12 Kamstrup
- 8.13 Kontron AG (S&T AG)
- 8.14 Landis+Gyr
- 8.15 LARSEN & TOUBRO LIMITED
- 8.16 Mitsubishi Electric Corporation
- 8.17 OSAKI ELECTRIC CO., LTD.
- 8.18 Schneider Electric
- 8.19 Sensus
- 8.20 Siemens
- 8.21 ZIV

