
PUBLISHER: Global Market Insights Inc. | PRODUCT CODE: 1685184

PUBLISHER: Global Market Insights Inc. | PRODUCT CODE: 1685184
Honey Market Opportunity, Growth Drivers, Industry Trend Analysis, and Forecast 2025 - 2034
The Global Honey Market was valued at USD 9.2 billion in 2024 and is projected to experience steady growth, expanding at a CAGR of 4.7% between 2025 and 2034. This growth is primarily driven by an increasing consumer shift toward natural sweeteners. As more people move away from processed sugars, honey is emerging as a preferred alternative due to its natural composition and health benefits. This trend is further fueled by a growing consumer demand for clean-label products-foods that are minimally processed and free from artificial additives. Honey's reputation as a natural, wholesome ingredient is increasingly aligning with modern health-conscious choices. In addition, as awareness around the benefits of sustainable and ethical food production grows, honey, particularly raw and organic varieties, is gaining popularity in both culinary and wellness circles. This dynamic shift in consumer preferences is expected to continue to accelerate the demand for honey in the coming years.
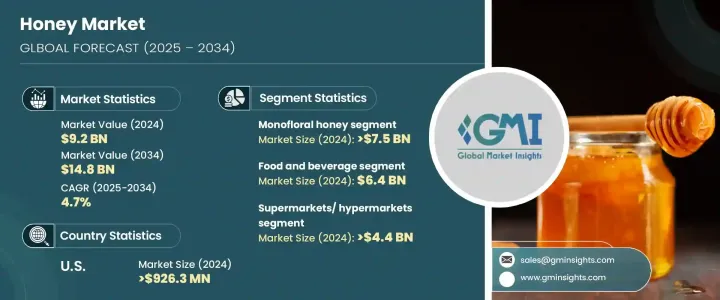
The monofloral segment of the honey market accounted for USD 7.5 billion in 2024 and is set to grow at a CAGR of 4.6% from 2025 to 2034. Monofloral honey, derived from the nectar of a single flower variety, has established itself as a premium choice due to its distinctive flavor profiles and potent health benefits. Consumers favor this type of honey for its purity and the therapeutic effects linked to the specific flowers from which it is sourced. As the demand for high-quality specialty foods rises, monofloral honey is increasingly seen as a top-tier product in both the domestic and global markets. Its growing popularity among those seeking unique tastes and natural remedies positions it as a standout within the broader honey industry.
| Market Scope | |
|---|---|
| Start Year | 2024 |
| Forecast Year | 2025-2034 |
| Start Value | $9.2 Billion |
| Forecast Value | $14.8 Billion |
| CAGR | 4.7% |
In terms of application, the food and beverage sector leads, generating USD 6.4 billion in 2024. Honey's versatility as a natural sweetener has made it indispensable across multiple food categories, including baked goods, beverages, snacks, and sweets. Its use as a healthier substitute for refined sugars has grown significantly, especially in products targeting health-conscious consumers. As the market continues to prioritize clean, natural ingredients, honey's role in various food formulations is expected to grow, with this segment projected to expand at a CAGR of 4.5% from 2025 to 2034.
The U.S. honey market alone reached USD 926.3 million in 2024, with expectations for a 5% CAGR through 2034. The surge in demand for natural sweeteners and the growing preference for healthier food choices have contributed to this increase. The U.S. market benefits from an extensive distribution network, making honey readily available in supermarkets, health food stores, and online platforms. As more consumers choose organic and raw honey varieties, this robust infrastructure supports widespread access to high-quality products.
Table of Contents
Chapter 1 Methodology & Scope
- 1.1 Market scope & definitions
- 1.2 Base estimates & calculations
- 1.3 Forecast calculations
- 1.4 Data sources
- 1.4.1 Primary
- 1.4.2 Secondary
- 1.4.2.1 Paid sources
- 1.4.2.2 Public sources
Chapter 2 Executive Summary
- 2.1 Industry synopsis, 2021-2034
Chapter 3 Industry Insights
- 3.1 Industry ecosystem analysis
- 3.1.1 Factor affecting the value chain
- 3.1.2 Profit margin analysis
- 3.1.3 Disruptions
- 3.1.4 Future outlook
- 3.1.5 Manufacturers
- 3.1.6 Distributors
- 3.2 Supplier landscape
- 3.3 Profit margin analysis
- 3.4 Key news & initiatives
- 3.5 Regulatory landscape
- 3.6 Impact forces
- 3.6.1 Growth drivers
- 3.6.1.1 Increasing demand for premium and craft beverages
- 3.6.1.2 Technological advancements in brewing processes
- 3.6.1.3 Growth in home brewing and microbreweries
- 3.6.2 Industry pitfalls & challenges
- 3.6.2.1 Fluctuations in raw material availability
- 3.6.1 Growth drivers
- 3.7 Growth potential analysis
- 3.8 Porter’s analysis
- 3.9 PESTEL analysis
Chapter 4 Competitive Landscape, 2024
- 4.1 Introduction
- 4.2 Company market share analysis
- 4.3 Competitive positioning matrix
- 4.4 Strategic outlook matrix
Chapter 5 Market Estimates & Forecast, By Type, 2021-2034 (USD Billion) (Kilo Tons)
- 5.1 Key trends
- 5.2 Organic Wildflower honey
- 5.3 Monofloral honey (flavoured honey)
- 5.3.1 Clover
- 5.3.2 Orange
- 5.3.3 Buckwheat
- 5.3.4 Others
Chapter 6 Market Estimates & Forecast, By Application, 2021-2034 (USD Billion) (Kilo Tons)
- 6.1 Key trends
- 6.2 Food and beverages
- 6.3 Personal care and cosmetics
- 6.4 Pharmaceuticals
- 6.5 Others
Chapter 7 Market Estimates & Forecast, By Distribution channel, 2021-2034 (USD Billion) (Kilo Tons)
- 7.1 Key trends
- 7.2 Supermarkets/ Hypermarkets
- 7.3 Convenience stores
- 7.4 Online retailers
- 7.5 Others
Chapter 8 Market Estimates & Forecast, By Region, 2021-2034 (USD Billion) (Kilo Tons)
- 8.1 Key trends
- 8.2 North America
- 8.2.1 U.S.
- 8.2.2 Canada
- 8.3 Europe
- 8.3.1 UK
- 8.3.2 Germany
- 8.3.3 France
- 8.3.4 Italy
- 8.3.5 Spain
- 8.3.6 Russia
- 8.4 Asia Pacific
- 8.4.1 China
- 8.4.2 India
- 8.4.3 Japan
- 8.4.4 South Korea
- 8.4.5 Australia
- 8.5 Latin America
- 8.5.1 Brazil
- 8.5.2 Mexico
- 8.6 MEA
- 8.6.1 South Africa
- 8.6.2 Saudi Arabia
- 8.6.3 UAE
Chapter 9 Company Profiles
- 9.1 Barkman Honey
- 9.2 Bee Maid Honey
- 9.3 Beeyond the Hive
- 9.4 Billy Bee Honey Products
- 9.5 Capilano Honey
- 9.6 Comvita
- 9.7 Dabur India
- 9.8 Dutch Gold Honey
- 9.9 GloryBee
- 9.10 Golden Acres Honey
- 9.11 Little Bee Impex
- 9.12 New Zealand Honey
- 9.13 Oha Honey LP
- 9.14 Savannah Bee Company
- 9.15 Streamland Biological Technology

