
PUBLISHER: Global Market Insights Inc. | PRODUCT CODE: 1667054

PUBLISHER: Global Market Insights Inc. | PRODUCT CODE: 1667054
Asia Pacific Gasoline Gensets Market Opportunity, Growth Drivers, Industry Trend Analysis, and Forecast 2025 - 2034
Asia Pacific Gasoline Gensets Market, valued at USD 3.1 billion in 2024, is expected to experience robust growth, with a projected CAGR of 4.5% from 2025 to 2034. This growth is largely driven by the region's rapid infrastructure development and booming construction sector, both of which are pivotal to economic advancement. Additionally, the region's increasing demand for reliable power solutions, especially in rapidly urbanizing economies, is contributing to the positive market outlook. The gasoline gensets market is also benefiting from rising awareness of power generation solutions that can ensure business continuity and enhance productivity in areas with limited or unstable access to grid power.
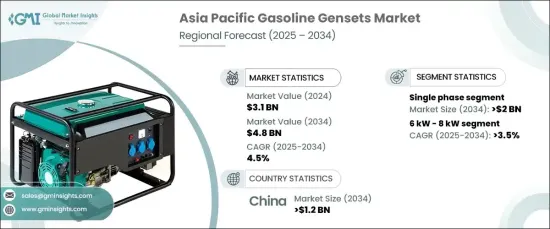
As the demand for uninterrupted power supply continues to rise, the single-phase gasoline gensets segment is projected to generate USD 2 billion by 2034. This growth is supported by significant investments across various sectors, including real estate, commercial, and construction industries. The expansion of these sectors in the region directly fuels the need for dependable power solutions. The market is also witnessing a surge in the adoption of technological innovations, including smart and hybrid generator systems, which improve operational efficiency, performance, and environmental impact. These advancements are fostering greater product acceptance across a broad range of applications.
| Market Scope | |
|---|---|
| Start Year | 2024 |
| Forecast Year | 2025-2034 |
| Start Value | $3.1 Billion |
| Forecast Value | $4.8 Billion |
| CAGR | 4.5% |
The 6 kW - 8 kW gasoline gensets market is anticipated to grow at a steady rate of 3.5% through 2034. Increasingly frequent power outages, deteriorating grid infrastructure, and the rising occurrence of natural disasters are all contributing to the demand for these gensets. Known for their cost-effectiveness and reliability, these gensets provide vital backup power, making them particularly indispensable in the construction sector. Their ability to power job sites without access to grid electricity ensures smooth and uninterrupted project execution, which is crucial for maintaining progress and meeting deadlines in construction activities across multiple industries.
In China, the gasoline gensets market is projected to generate USD 1.2 billion by 2034. The country's rapid urbanization and the increased frequency of extreme weather events are major drivers behind the rising demand for dependable and efficient energy solutions. Government initiatives, such as subsidies for clean energy technologies and policies that encourage the use of distributed energy resources, are playing a significant role in enhancing the market dynamics. Furthermore, the introduction of stricter emissions regulations to tackle air pollution and improve air quality is driving the adoption of advanced genset technologies, aligning with China's sustainability goals.
The Asia Pacific gasoline gensets market is thriving as a result of the region's expanding infrastructure, increasing energy needs, and continuous technological advancements. Government initiatives that support cleaner, more efficient power solutions are further accelerating the growth of this market. As urbanization progresses and industries across the region continue to require uninterrupted power, the demand for high-performance gasoline gensets is set to remain strong. These trends suggest a sustained and dynamic market evolution, meeting the growing demand for reliable and versatile power generation solutions.
Table of Contents
Chapter 1 Methodology & Scope
- 1.1 Market scope & definitions
- 1.2 Market estimates & forecast parameters
- 1.3 Forecast calculation
- 1.4 Data sources
- 1.4.1 Primary
- 1.4.2 Secondary
- 1.4.2.1 Paid
- 1.4.2.2 Public
Chapter 2 Industry Insights
- 2.1 Industry ecosystem analysis
- 2.2 Regulatory landscape
- 2.3 Industry impact forces
- 2.3.1 Growth drivers
- 2.3.2 Industry pitfalls & challenges
- 2.4 Growth potential analysis
- 2.5 Porter's analysis
- 2.5.1 Bargaining power of suppliers
- 2.5.2 Bargaining power of buyers
- 2.5.3 Threat of new entrants
- 2.5.4 Threat of substitutes
- 2.6 PESTEL analysis
Chapter 3 Competitive Landscape, 2024
- 3.1 Introduction
- 3.2 Strategic outlook
- 3.3 Innovation & sustainability landscape
Chapter 4 Market Size and Forecast, By Power Rating, 2021 – 2034 ('000 Units & USD Million)
- 4.1 Key trends
- 4.2 < 2 kW
- 4.3 2 kW - 5 kW
- 4.4 6 kW - 8 kW
- 4.5 > 8 kW - 15 kW
Chapter 5 Market Size and Forecast, By Phase, 2021 – 2034 ('000 Units & USD Million)
- 5.1 Key trends
- 5.2 Single phase
- 5.3 Three phase
Chapter 6 Market Size and Forecast, By End Use, 2021 – 2034 ('000 Units & USD Million)
- 6.1 Key trends
- 6.2 Residential
- 6.3 Commercial
- 6.4 Construction
Chapter 7 Market Size and Forecast, By Country, 2021 – 2034 ('000 Units & USD Million)
- 7.1 Key trends
- 7.2 Australia
- 7.3 Japan
- 7.4 China
- 7.5 India
- 7.6 Indonesia
- 7.7 Thailand
- 7.8 Philippines
- 7.9 Malaysia
- 7.10 Singapore
- 7.11 Vietnam
- 7.12 South Korea
Chapter 8 Company Profiles
- 8.1 Briggs & Stratton
- 8.2 Caterpillar
- 8.3 Cooper Corporation
- 8.4 Cummins
- 8.5 Deere & Company
- 8.6 Generac Power Systems
- 8.7 Himalayan Power Machines
- 8.8 Honda Motor
- 8.9 Kirloskar
- 8.10 MAHINDRA POWEROL
- 8.11 Rehlko
- 8.12 Shaktiman Equipments
- 8.13 Wacker Neuson SE
- 8.14 Yamaha Motor

