Picture
SEARCH
What are you looking for?
Need help finding what you are looking for? Contact Us
Compare

PUBLISHER: Global Market Insights Inc. | PRODUCT CODE: 1395022

Cover Image

PUBLISHER: Global Market Insights Inc. | PRODUCT CODE: 1395022

North America Air Insulated Switchgear Market Size - By Voltage (Medium {> 3 kV to ≤ 36 kV}, High {> 36 kV}), By Application (Residential, Commercial & Industrial, Utility) & Forecast, 2023 - 2032

PUBLISHED:
PAGES: 120 Pages
DELIVERY TIME: 2-3 business days
SELECT AN OPTION
PDF & Excel (Single User License)
USD 3250
PDF & Excel (Multi User License)
USD 3750
PDF & Excel (Enterprise User License)
USD 5750

Add to Cart

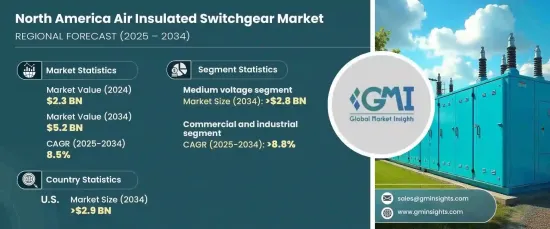
North America Air Insulated Switchgear Market size will witness 8.7% CAGR between 2023 and 2032, fueled by innovative product launches from top global companies. With a focus on modernizing electrical infrastructure, these launches introduce advanced technologies and enhanced functionalities.

For instance, in May 2022, Schneider Electric, renowned for energy management and automation, introduced SureSeT MV switchgear tailored for North America. This advanced solution, powered by the innovative EvoPacT circuit breaker, supersedes the Masterclad solution. It presents a compact, robust, and intelligent alternative for overseeing daily digital operations in primary switchgear applications. This air-insulated, metal-clad switchgear, featuring acclaimed vacuum EvoPacT circuit breakers, presents cutting-edge technology ideal for large and intricate medium voltage (MV) power distribution and control, ensuring top-tier performance.

The influx of new offerings from leading companies caters to evolving industry needs, ensuring improved reliability and efficiency in power distribution. As these innovations redefine standards and capabilities, they stimulate air insulated switchgear market growth, meeting the increasing demand for cutting-edge solutions across North America.

The overall North America Air Insulated Switchgear Market is classified based on voltage, application, and country.

High (> 36 kV) segment will record significant growth from 2023 to 2032. As industries and utilities seek robust infrastructure for higher voltage applications, the focus intensifies on reliable and efficient switchgear. This segment's growth reflects the need for enhanced power distribution and control in complex settings. With increased industrialization and evolving energy needs, the demand for high-voltage air-insulated switchgear market demand in North America underscores its pivotal role in ensuring safe and efficient electricity management across diverse sectors.

Commercial and industrial segment will capture a noteworthy air insulated switchgear market share by 2032. As businesses prioritize reliable power distribution, switchgear solutions become instrumental in ensuring uninterrupted operations. Industries and commercial entities seek robust, efficient systems for managing electricity flow. The air insulated switchgear market growth reflects this essential need for dependable infrastructure to support critical operations. Air insulated switchgear stands as a cornerstone, meeting the escalating demand in North America's commercial and industrial landscape, facilitating efficient and secure power distribution.

Canada air insulated switchgear industry will showcase a commendable CAGR from 2023 to 2032. Driven by the country's diverse industrial landscape and growing commercial needs, the emphasis on reliable power distribution amplifies. As Canada advances its infrastructure, particularly in energy-intensive sectors like mining and manufacturing, the demand for efficient, high-performance switchgear escalates. Air Insulated Switchgear stands as a crucial component in meeting Canada's evolving energy demands, playing a pivotal role in ensuring safe and seamless electricity management across various sectors in the country.

Product Code: 6914

Table of Contents

Chapter 1 Methodology & Scope

  • 1.1 Market scope and definitions
  • 1.2 Base estimates & calculations
  • 1.3 Forecast calculations
  • 1.4 Data sources
    • 1.4.1 Primary
    • 1.4.2 Secondary
      • 1.4.2.1 Paid sources
      • 1.4.2.2 Public sources

Chapter 2 North America Air Insulated Switchgear Industry Insights

  • 2.1 Industry ecosystem analysis
    • 2.1.1 Vendor matrix
  • 2.2 Regulatory landscape
  • 2.3 Industry impact forces
    • 2.3.1 Growth drivers
    • 2.3.2 Industry pitfalls & challenges
  • 2.4 Growth potential analysis
  • 2.5 Porter's Analysis
    • 2.5.1 Bargaining power of suppliers
    • 2.5.2 Bargaining power of buyers
    • 2.5.3 Threat of new entrants
    • 2.5.4 Threat of substitutes
  • 2.6 PESTEL Analysis

Chapter 3 Competitive Benchmarking

  • 3.1 Innovation & sustainability landscape
  • 3.2 Competitive landscape, 2022
    • 3.2.1 Strategy dashboard

Chapter 4 North America Air Insulated Switchgear Market, By Voltage

  • 4.1 Key voltage trends
  • 4.2 Medium (> 3 kV to ≤ 36 kV)
  • 4.3 High (> 36 kV)

Chapter 5 North America Air Insulated Switchgear Market, By Application

  • 5.1 Key application trends
  • 5.2 Residential
  • 5.3 Commercial & industrial
  • 5.4 Utility

Chapter 6 North America Air Insulated Switchgear Market, By Country

  • 6.1 Key country trends
  • 6.2 U.S.
  • 6.3 Canada
  • 6.4 Mexico

Chapter 7 Company Profiles

  • 7.1 ABB
  • 7.2 Siemens
  • 7.3 General Electric
  • 7.4 Mitsubishi Heavy Industries, Ltd.
  • 7.5 Hitachi Energy Ltd.
  • 7.6 Schneider Electric
  • 7.7 alfanar Group
  • 7.8 Eaton
  • 7.9 Chint Group
  • 7.10 Toshiba Corporation
  • 7.11 HD HYUNDAI ELECTRIC CO., LTD.
  • 7.12 Powell Industries
  • 7.13 Ormazabal
  • 7.14 Lucy Electric Ltd.
  • 7.15 Meidensha Corporation
Product Code: 6914

Data Tables

  • TABLE 1 Industry impact forces
  • TABLE 2 North America market from medium (> 3 kV to ≤ 36 kV), 2019 - 2022 (Volume & Revenue)
  • TABLE 3 North America market from medium (> 3 kV to ≤ 36 kV), 2023 - 2027 (Volume & Revenue)
  • TABLE 4 North America market from medium (> 3 kV to ≤ 36 kV), 2028 - 2032 (Volume & Revenue)
  • TABLE 5 North America market from medium (> 3 kV to ≤ 36 kV), by country, 2019 - 2022 ('000 Units)
  • TABLE 6 North America market from medium (> 3 kV to ≤ 36 kV), by country, 2023 - 2027 ('000 Units)
  • TABLE 7 North America market from medium (> 3 kV to ≤ 36 kV), by country, 2028 - 2032 ('000 Units)
  • TABLE 8 North America market from medium (> 3 kV to ≤ 36 kV), by country, 2019 - 2022 (USD Million)
  • TABLE 9 North America market from medium (> 3 kV to ≤ 36 kV), by country, 2023 - 2027 (USD Million)
  • TABLE 10 North America market from medium (> 3 kV to ≤ 36 kV), by country, 2028 - 2032 (USD Million)
  • TABLE 11 North America market from high (> 36 kV), 2019 - 2022 (Volume & Revenue)
  • TABLE 12 North America market from high (> 36 kV), 2023 - 2027 (Volume & Revenue)
  • TABLE 13 North America market from high (> 36 kV), 2028 - 2032 (Volume & Revenue)
  • TABLE 14 North America market from high (> 36 kV), by country, 2019 - 2022 ('000 Units)
  • TABLE 15 North America market from high (> 36 kV), by country, 2023 - 2027 ('000 Units)
  • TABLE 16 North America market from high (> 36 kV), by country, 2028 - 2032 ('000 Units)
  • TABLE 17 North America market from high (> 36 kV), by country, 2019 - 2022 (USD Million)
  • TABLE 18 North America market from high (> 36 kV), by country, 2023 - 2027 (USD Million)
  • TABLE 19 North America market from high (> 36 kV), by country, 2028 - 2032 (USD Million)
  • TABLE 20 North America market from residential, 2019 - 2022 (Volume & Revenue)
  • TABLE 21 North America market from residential, 2023 - 2027 (Volume & Revenue)
  • TABLE 22 North America market from residential, 2028 - 2032 (Volume & Revenue)
  • TABLE 23 North America market from residential, by country, 2019 - 2022 ('000 Units)
  • TABLE 24 North America market from residential, by country, 2023 - 2027 ('000 Units)
  • TABLE 25 North America market from residential, by country, 2028 - 2032 ('000 Units)
  • TABLE 26 North America market from residential, by country, 2019 - 2022 (USD Million)
  • TABLE 27 North America market from residential, by country, 2023 - 2027 (USD Million)
  • TABLE 28 North America market from residential, by country, 2028 - 2032 (USD Million)
  • TABLE 29 North America market from commercial & industrial, 2019 - 2022 (Volume & Revenue)
  • TABLE 30 North America market from commercial & industrial, 2023 - 2027 (Volume & Revenue)
  • TABLE 31 North America market from commercial & industrial, 2028 - 2032 (Volume & Revenue)
  • TABLE 32 North America market from commercial & industrial, by country, 2019 - 2022 ('000 Units)
  • TABLE 33 North America market from commercial & industrial, by country, 2023 - 2027 ('000 Units)
  • TABLE 34 North America market from commercial & industrial, by country, 2028 - 2032 ('000 Units)
  • TABLE 35 North America market from commercial & industrial, by country, 2019 - 2022 (USD Million)
  • TABLE 36 North America market from commercial & industrial, by country, 2023 - 2027 (USD Million)
  • TABLE 37 North America market from commercial & industrial, by country, 2028 - 2032 (USD Million)
  • TABLE 38 North America market from utility, 2019 - 2022 (Volume & Revenue)
  • TABLE 39 North America market from utility, 2023 - 2027 (Volume & Revenue)
  • TABLE 40 North America market from utility, 2028 - 2032 (Volume & Revenue)
  • TABLE 41 North America market from utility, by country, 2019 - 2022 ('000 Units)
  • TABLE 42 North America market from utility, by country, 2023 - 2027 ('000 Units)
  • TABLE 43 North America market from utility, by country, 2028 - 2032 ('000 Units)
  • TABLE 44 North America market from utility, by country, 2019 - 2022 (USD Million)
  • TABLE 45 North America market from utility, by country, 2023 - 2027 (USD Million)
  • TABLE 46 North America market from utility, by country, 2028 - 2032 (USD Million)
  • TABLE 47 U.S. market, 2019 - 2022 (Volume & Revenue)
  • TABLE 48 U.S. market, 2023 - 2027 (Volume & Revenue)
  • TABLE 49 U.S. market, 2028 - 2032 (Volume & Revenue)
  • TABLE 50 U.S. market by voltage, 2019 - 2022 ('000 Units)
  • TABLE 51 U.S. market by voltage, 2023 - 2027 ('000 Units)
  • TABLE 52 U.S. market by voltage, 2028 - 2032 ('000 Units)
  • TABLE 53 U.S. market by voltage, 2019 - 2022 (USD Million)
  • TABLE 54 U.S. market by voltage, 2023 - 2027 (USD Million)
  • TABLE 55 U.S. market by voltage, 2028 - 2032 (USD Million)
  • TABLE 56 U.S. market by application, 2019 - 2022 ('000 Units)
  • TABLE 57 U.S. market by application, 2023 - 2027 ('000 Units)
  • TABLE 58 U.S. market by application, 2028 - 2032 ('000 Units)
  • TABLE 59 U.S. market by application, 2019 - 2022 (USD Million)
  • TABLE 60 U.S. market by application, 2023 - 2027 (USD Million)
  • TABLE 61 U.S. market by application, 2028 - 2032 (USD Million)
  • TABLE 62 Canada market, 2019 - 2022 (Volume & Revenue)
  • TABLE 63 Canada market, 2023 - 2027 (Volume & Revenue)
  • TABLE 64 Canada market, 2028 - 2032 (Volume & Revenue)
  • TABLE 65 Canada market by voltage, 2019 - 2022 ('000 Units)
  • TABLE 66 Canada market by voltage, 2023 - 2027 ('000 Units)
  • TABLE 67 Canada market by voltage, 2028 - 2032 ('000 Units)
  • TABLE 68 Canada market by voltage, 2019 - 2022 (USD Million)
  • TABLE 69 Canada market by voltage, 2023 - 2027 (USD Million)
  • TABLE 70 Canada market by voltage, 2028 - 2032 (USD Million)
  • TABLE 71 Canada market by application, 2019 - 2022 ('000 Units)
  • TABLE 72 Canada market by application, 2023 - 2027 ('000 Units)
  • TABLE 73 Canada market by application, 2028 - 2032 ('000 Units)
  • TABLE 74 Canada market by application, 2019 - 2022 (USD Million)
  • TABLE 75 Canada market by application, 2023 - 2027 (USD Million)
  • TABLE 76 Canada market by application, 2028 - 2032 (USD Million)
  • TABLE 77 Mexico market, 2019 - 2022 (Volume & Revenue)
  • TABLE 78 Mexico market, 2023 - 2027 (Volume & Revenue)
  • TABLE 79 Mexico market, 2028 - 2032 (Volume & Revenue)
  • TABLE 80 Mexico market by voltage, 2019 - 2022 ('000 Units)
  • TABLE 81 Mexico market by voltage, 2023 - 2027 ('000 Units)
  • TABLE 82 Mexico market by voltage, 2028 - 2032 ('000 Units)
  • TABLE 83 Mexico market by voltage, 2019 - 2022 (USD Million)
  • TABLE 84 Mexico market by voltage, 2023 - 2027 (USD Million)
  • TABLE 85 Mexico market by voltage, 2028 - 2032 (USD Million)
  • TABLE 86 Mexico market by application, 2019 - 2022 ('000 Units)
  • TABLE 87 Mexico market by application, 2023 - 2027 ('000 Units)
  • TABLE 88 Mexico market by application, 2028 - 2032 ('000 Units)
  • TABLE 89 Mexico market by application, 2019 - 2022 (USD Million)
  • TABLE 90 Mexico market by application, 2023 - 2027 (USD Million)
  • TABLE 91 Mexico market by application, 2028 - 2032 (USD Million)

Charts & Figures

  • FIG. 1 GMI report coverage: critical research elements
  • FIG. 2 Industry segmentation
  • FIG. 3 Market forecasting methodology
  • FIG. 4 Profile break-up of primary respondents
  • FIG. 5 Industry ecosystem analysis
  • FIG. 6 Growth potential analysis
  • FIG. 7 Porter's Analysis
  • FIG. 8 PESTEL Analysis
  • FIG. 9 SWOT Analysis, ABB
  • FIG. 10 SWOT Analysis, Siemens
  • FIG. 11 SWOT Analysis, General Electric
  • FIG. 12 SWOT Analysis, Mitsubishi Heavy Industries, Ltd.
  • FIG. 13 SWOT Analysis, Hitachi Energy Ltd.
  • FIG. 14 SWOT Analysis, Schneider Electric
  • FIG. 15 SWOT Analysis, alfanar Group
  • FIG. 16 SWOT Analysis, Eaton
  • FIG. 17 SWOT Analysis, Chint Group
  • FIG. 18 SWOT Analysis, Toshiba Corporation
  • FIG. 19 SWOT Analysis, HD HYUNDAI ELECTRIC CO., LTD.
  • FIG. 20 SWOT Analysis, Powell Industries
  • FIG. 21 SWOT Analysis, Ormazabal
  • FIG. 22 SWOT Analysis, Lucy Electric Ltd.
  • FIG. 23 SWOT Analysis, Meidensha Corporation
Have a question?
Picture

Jeroen Van Heghe

Manager - EMEA

+32-2-535-7543

Picture

Christine Sirois

Manager - Americas

+1-860-674-8796

Questions? Please give us a call or visit the contact form.
Hi, how can we help?
Contact us!