
PUBLISHER: Global Market Insights Inc. | PRODUCT CODE: 1666921

PUBLISHER: Global Market Insights Inc. | PRODUCT CODE: 1666921
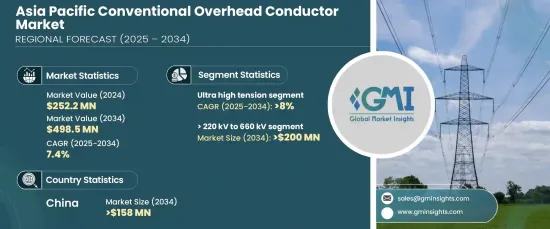
Asia Pacific Conventional Overhead Conductor Market Opportunity, Growth Drivers, Industry Trend Analysis, and Forecast 2025 - 2034
Asia Pacific Conventional Overhead Conductor Market, reaching a valuation of USD 252.2 million in 2024, is estimated to depict a CAGR of 7.4% from 2025 to 2034. This growth is primarily driven by the ongoing replacement and upgrading of outdated grid infrastructure. The demand for robust, high-strength transmission lines reflects the need for an improved energy grid that is secure, sustainable, and reliable. Efforts to modernize and reinforce the power grid are poised to bring considerable benefits to the industry in the coming years.
Initiatives to modernize the grid, such as advances in energy storage solutions, smart grid technologies, and integration of innovative systems, are creating a highly competitive environment. The growing adoption of information technology in the electricity sector is expected to accelerate the deployment of smart grid infrastructure, which will enhance the long-term growth prospects of the market.
| Market Scope | |
|---|---|
| Start Year | 2024 |
| Forecast Year | 2025-2034 |
| Start Value | $252.2 Million |
| Forecast Value | $498.5 Million |
| CAGR | 7.4% |
In terms of voltage, the segment of conventional overhead conductors rated between 220 kV and 660 kV is projected to exceed USD 200 million by 2034. A strategic shift towards upgrading and restructuring existing electricity infrastructure across commercial, industrial, and utility sectors is anticipated to transform the market landscape. The integration of renewable energy sources into national grids, coupled with efforts to modernize high-voltage transmission systems, is set to significantly impact industry growth.
The ultra-high tension overhead conductor segment is forecast to expand at a CAGR of more than 8% until 2034. This growth is fueled by the increasing demand for electricity in emerging markets, along with policy support promoting the use of these conductors in cross-border transmission projects. The rising need for secure, long-distance electricity transmission will further enhance the prospects for this market segment.
The conventional overhead conductor market in China is also expected to reach over USD 158 million by 2034. Growth in the country is expected to be supported by efforts to ensure a stable power supply, increase electricity consumption, and improve grid connectivity in less developed areas. In addition, changing consumption patterns and investments in expanding power generation capacity are expected to contribute positively to the market's growth trajectory.
Table of Contents
Chapter 1 Methodology & Scope
- 1.1 Market scope & definitions
- 1.2 Market estimates & forecast parameters
- 1.3 Forecast calculation
- 1.4 Data sources
- 1.4.1 Primary
- 1.4.2 Secondary
- 1.4.2.1 Paid
- 1.4.2.2 Public
Chapter 2 Industry Insights
- 2.1 Industry ecosystem analysis
- 2.2 Regulatory landscape
- 2.3 Industry impact forces
- 2.3.1 Growth drivers
- 2.3.2 Industry pitfalls & challenges
- 2.4 Growth potential analysis
- 2.5 Porter's analysis
- 2.5.1 Bargaining power of suppliers
- 2.5.2 Bargaining power of buyers
- 2.5.3 Threat of new entrants
- 2.5.4 Threat of substitutes
- 2.6 PESTEL analysis
Chapter 3 Competitive Landscape, 2024
- 3.1 Introduction
- 3.2 Strategic outlook
- 3.3 Innovation & sustainability landscape
Chapter 4 Market Size and Forecast, By Product, 2021 – 2034 (km, USD Million)
- 4.1 Key trends
- 4.2 ACSR
- 4.3 AAAC
- 4.4 ACAR
- 4.5 AACSR
- 4.6 AAC
Chapter 5 Market Size and Forecast, By Voltage, 2021 – 2034 (km, USD Million)
- 5.1 Key trends
- 5.2 132 kV to 220 kV
- 5.3 > 220 kV to 660 kV
- 5.4 > 660 kV
Chapter 6 Market Size and Forecast, By Application, 2021 – 2034 (km, USD Million)
- 6.1 Key trends
- 6.2 High tension
- 6.3 Extra high tension
- 6.4 Ultra high tension
Chapter 7 Market Size and Forecast, By Country, 2021 – 2034 (km, USD Million)
- 7.1 Key trends
- 7.2 China
- 7.3 Australia
- 7.4 India
- 7.5 Japan
- 7.6 South Korea
- 7.7 Indonesia
- 7.8 New Zealand
- 7.9 Malaysia
Chapter 8 Company Profiles
- 8.1 3M
- 8.2 Bekaert
- 8.3 Cabcon India
- 8.4 CMI
- 8.5 CTC Global
- 8.6 Eland Cables
- 8.7 Elsewedy Electric
- 8.8 Galaxy Transmissions
- 8.9 Gupta Power
- 8.10 Hindustan Urban Infrastructure
- 8.11 KEI Industries
- 8.12 LS Cable & System
- 8.13 Nexans
- 8.14 Prysmian Group
- 8.15 Special Cables
- 8.16 Sterlite Power
- 8.17 Sumitomo Electric
- 8.18 Tropical Cable & Conductor
- 8.19 ZMS Cable
- 8.20 ZTT

