
PUBLISHER: Global Market Insights Inc. | PRODUCT CODE: 1741024

PUBLISHER: Global Market Insights Inc. | PRODUCT CODE: 1741024
Static VAR Compensator Market Opportunity, Growth Drivers, Industry Trend Analysis, and Forecast 2025 - 2034
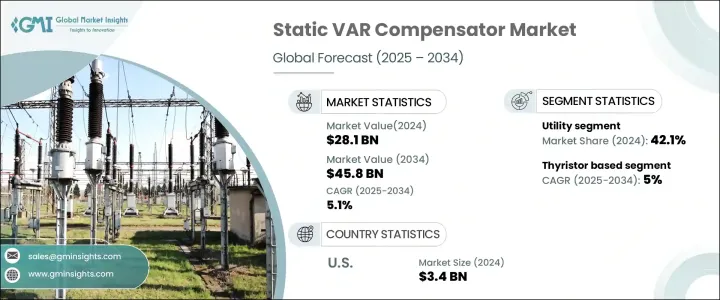
The Global Static VAR Compensator Market was valued at USD 28.1 billion in 2024 and is estimated to grow at a CAGR of 5.1% to reach USD 45.8 billion by 2034, fueled by the accelerating integration of renewable energy sources into modern power grids and the growing necessity for precise reactive power control. As the energy landscape undergoes rapid transformation, power grids are facing unprecedented demands for reliability, flexibility, and resilience. The shift toward decentralized energy systems, driven by solar, wind, and other renewable sources, is pushing grid operators to adopt advanced technologies capable of managing fluctuating energy inputs.
Static VAR Compensators (SVCs) have emerged as essential components for grid stability, offering dynamic reactive power support and real-time voltage regulation. Their deployment is no longer optional but a necessity, as grids modernize to accommodate clean energy mandates, urbanization, and rising electricity consumption worldwide. Investment in SVC technologies is also being propelled by the need to minimize energy losses, optimize transmission capacity, and ensure compliance with increasingly stringent grid codes across different regions. With governments and utilities prioritizing the upgrade of aging infrastructure and the development of smart grids, the Static VAR Compensator market is positioned for steady, long-term expansion.
| Market Scope | |
|---|---|
| Start Year | 2024 |
| Forecast Year | 2025-2034 |
| Start Value | $28.1 Billion |
| Forecast Value | $45.8 Billion |
| CAGR | 5.1% |
As solar, wind, and other intermittent energy sources continue to scale, maintaining voltage stability across transmission networks becomes increasingly complex. SVCs play a critical role in this environment-they dynamically regulate voltage fluctuations, absorb or generate reactive power as needed, and help avoid grid disturbances. Their ability to respond in real-time to load variations makes them vital for preventing power quality issues, reducing transmission losses, and enhancing the overall efficiency of the electrical infrastructure. As nations push forward with ambitious clean energy goals, the role of grid-supportive technologies like Static VAR Compensators becomes increasingly critical. These systems not only enable smoother integration of renewable power but also provide dynamic voltage regulation and reactive power support-functions that traditional grid infrastructure struggles to deliver at scale. The rapid growth of solar and wind farms introduces fluctuations in energy output, and without SVCs, these irregularities could lead to voltage instability, power outages, or damage to sensitive equipment.
The thyristor-based static VAR compensator segment is expected to grow at a CAGR of 5% through 2034. Demand for these systems remains robust due to the ongoing need for reactive power regulation and voltage stability across electrical grids. Utilities and industries are increasingly relying on SVCs to mitigate voltage fluctuations and address power factor issues, both of which are essential for maintaining a reliable power supply. Additionally, the rapid industrialization in emerging economies, leading to higher power consumption, is further driving the adoption of these compensators.
The utility-based static VAR compensator segment held a 42.1% share in 2024. Increased investments in upgrading and expanding power grid infrastructure are significantly boosting the demand for SVCs. Utilities are constantly seeking solutions to reduce energy costs, optimize energy consumption, and enhance grid performance. SVCs help achieve these goals by improving power quality, reducing energy losses, and mitigating penalties associated with low power factors.
The U.S. Static VAR Compensator Market generated USD 3.4 billion in 2024, driven by the country's efforts to modernize its aging power infrastructure and integrate renewable energy sources into the grid. The push for enhanced grid stability, reduced energy losses, and the ability to meet increasing electricity demand is fueling the adoption of SVCs across both utility and industrial sectors. Government incentives promoting energy efficiency and the development of smart grid technologies are accelerating the deployment of these systems, further boosting the market.
Key players included in the Global Static VAR Compensator Market are RXPE, NISSIN ELECTRIC Co., Elco Power, GE Vernova, Sieyuan Electric, Wartsila, Merus Power, Delta Electronics, Mitsubishi Electric Power Products, Toshiba Energy Systems & Solutions Corporation, Komachine, Hitachi Energy, Nidec Industrial Solutions, JEMA Energy, American Superconductor, NR Electric Co., Clariant Power System, Siemens Energy, Eaton, and ABB. Companies in the static VAR compensator market are focusing on innovation, strategic partnerships, and geographic expansion to strengthen their presence. Many are heavily investing in R&D to enhance product efficiency, adaptability, and digital integration, especially to support renewable energy integration and smart grid applications. Collaborations with utility providers and governments are helping to secure large-scale infrastructure projects.
Table of Contents
Chapter 1 Methodology & Scope
- 1.1 Research design
- 1.2 Market estimates & forecast parameters
- 1.3 Forecast calculation
- 1.4 Data sources
- 1.4.1 Primary
- 1.4.2 Secondary
- 1.4.2.1 Paid
- 1.4.2.2 Public
- 1.5 Market definitions
Chapter 2 Executive Summary
- 2.1 Industry synopsis, 2021 - 2034
Chapter 3 Industry Insights
- 3.1 Industry ecosystem analysis
- 3.2 Regulatory landscape
- 3.3 Impact of Trump Administration Tariffs on trade & overall industry
- 3.4 Industry impact forces
- 3.4.1 Growth drivers
- 3.4.2 Industry pitfalls & challenges
- 3.5 Growth potential analysis
- 3.6 Porter's analysis
- 3.6.1 Bargaining power of suppliers
- 3.6.2 Bargaining power of buyers
- 3.6.3 Threat of new entrants
- 3.6.4 Threat of substitutes
- 3.7 PESTEL analysis
Chapter 4 Competitive Landscape, 2025
- 4.1 Introduction
- 4.2 Strategic outlook
- 4.3 Innovation & sustainability landscape
Chapter 5 Market Size and Forecast, By Product, 2021 - 2034 (USD Million)
- 5.1 Key trends
- 5.2 Thyristor-based
- 5.3 MCR-based
Chapter 6 Market Size and Forecast, By Application, 2021 - 2034 (USD Million)
- 6.1 Key trends
- 6.2 Utility
- 6.3 Railway
- 6.4 Industrial
- 6.5 Oil & gas
- 6.6 Others
Chapter 7 Market Size and Forecast, By Region, 2021 - 2034 (USD Million)
- 7.1 Key trends
- 7.2 North America
- 7.2.1 U.S.
- 7.2.2 Canada
- 7.2.3 Mexico
- 7.3 Europe
- 7.3.1 Germany
- 7.3.2 France
- 7.3.3 Russia
- 7.3.4 UK
- 7.3.5 Italy
- 7.3.6 Spain
- 7.3.7 Netherlands
- 7.3.8 Austria
- 7.4 Asia Pacific
- 7.4.1 China
- 7.4.2 Japan
- 7.4.3 South Korea
- 7.4.4 India
- 7.4.5 Australia
- 7.4.6 New Zealand
- 7.4.7 Malaysia
- 7.4.8 Indonesia
- 7.5 Middle East & Africa
- 7.5.1 Saudi Arabia
- 7.5.2 UAE
- 7.5.3 Qatar
- 7.5.4 Egypt
- 7.5.5 South Africa
- 7.5.6 Nigeria
- 7.5.7 Kuwait
- 7.5.8 Oman
- 7.6 Latin America
- 7.6.1 Brazil
- 7.6.2 Peru
- 7.6.3 Argentina
Chapter 8 Company Profiles
- 8.1 ABB
- 8.2 American Superconductor
- 8.3 Clariant Power System
- 8.4 Delta Electronics
- 8.5 Eaton
- 8.6 Elco Power
- 8.7 GE Vernova
- 8.8 Hitachi Energy
- 8.9 JEMA Energy
- 8.10 Komachine
- 8.11 Merus Power
- 8.12 Mitsubishi Electric Power Products
- 8.13 Nidec Industrial Solutions
- 8.14 NISSIN ELECTRIC Co.
- 8.15 NR Electric Co.
- 8.16 RXPE
- 8.17 Siemens Energy
- 8.18 Sieyuan Electric
- 8.19 Toshiba Energy Systems & Solutions Corporation
- 8.20 Wartsilä

