
PUBLISHER: Global Market Insights Inc. | PRODUCT CODE: 1685130

PUBLISHER: Global Market Insights Inc. | PRODUCT CODE: 1685130
Embedded Finance Market Opportunity, Growth Drivers, Industry Trend Analysis, and Forecast 2025 - 2034
The Global Embedded Finance Market was valued at USD 104.8 billion in 2024, with expectations to grow at an impressive CAGR of 23.3% from 2025 to 2034. This rapid expansion is largely fueled by the growing adoption of digital payments by both consumers and businesses. As more individuals demand convenient, integrated financial solutions for everyday transactions, businesses are increasingly embedding financial services directly into their platforms. By leveraging digital technologies, financial institutions, and tech companies are revolutionizing how financial services are delivered, allowing for seamless user experiences. As the demand for frictionless transactions rises, industries across the board are rushing to implement embedded finance models to cater to the needs of a tech-savvy, digitally connected population.
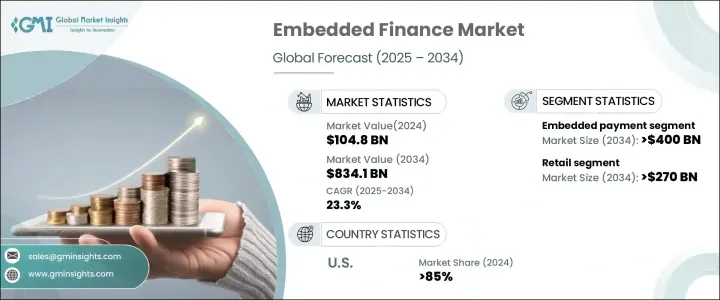
The market is segmented by service types, including payments, insurance, investment, lending, and banking. Of these, the embedded payments segment led the market in 2024, accounting for a 45% share, and is expected to generate a staggering USD 400 billion by 2034. A major driver behind this growth is the rise of decentralized finance (DeFi), which is disrupting the traditional financial services model. Through blockchain technology, platforms are able to integrate cryptocurrency payments, lending, and staking into their services. This approach removes the need for traditional banking intermediaries, offering a more secure and direct transaction process that appeals to younger, technology-driven consumers. DeFi also opens the door for financial inclusion, particularly in underbanked regions, by making financial products more accessible and less reliant on traditional banking infrastructure.
| Market Scope | |
|---|---|
| Start Year | 2024 |
| Forecast Year | 2025-2034 |
| Start Value | $104.8 Billion |
| Forecast Value | $834.1 Billion |
| CAGR | 23.3% |
The embedded finance market is utilized across several key sectors, such as retail, healthcare, logistics, manufacturing, and travel & entertainment. Among these, retail is projected to generate USD 270 billion by 2034. A key factor contributing to this growth is the integration of financial products into customer loyalty programs. Retailers are embracing digital wallets, co-branded credit cards, and point-of-sale financing options, all of which help boost customer engagement. These embedded financial solutions allow consumers to earn redeemable points for discounts, cashback, and special offers while retailers gain deeper insights into customer purchasing behavior, which can be used to refine marketing strategies.
In 2024, the U.S. dominated the embedded finance market with an 85% market share. The widespread adoption of digital platforms by traditional banks is a key reason for this growth. These banks are adapting by incorporating non-financial services-such as shopping, booking, and entertainment-into their digital offerings. Through strategic partnerships with retailers and service providers, banks are creating all-in-one ecosystems that offer consumers a wide range of services, making it easier for them to manage their finances and engage with the brands they love. These initiatives not only enhance customer retention but also create new revenue streams through commissions and data monetization.
Table of Contents
Chapter 1 Methodology & Scope
- 1.1 Research design
- 1.1.1 Research approach
- 1.1.2 Data collection methods
- 1.2 Base estimates and calculations
- 1.2.1 Base year calculation
- 1.2.2 Key trends for market estimates
- 1.3 Forecast model
- 1.4 Primary research & validation
- 1.4.1 Primary sources
- 1.4.2 Data mining sources
- 1.5 Market definitions
Chapter 2 Executive Summary
- 2.1 Industry 3600 synopsis, 2021 - 2034
Chapter 3 Industry Insights
- 3.1 Industry ecosystem analysis
- 3.2 Supplier landscape
- 3.2.1 Platform providers
- 3.2.2 Payment processors
- 3.2.3 Lending platforms
- 3.2.4 Technology providers
- 3.2.5 End users
- 3.3 Profit margin analysis
- 3.4 Technology differentiators
- 3.4.1 API-driven integration
- 3.4.2 Cloud-native architecture
- 3.4.3 Blockchain technology
- 3.4.4 Open banking protocols
- 3.4.5 Others
- 3.5 Key news & initiatives
- 3.6 Patent analysis
- 3.7 Regulatory landscape
- 3.8 Impact forces
- 3.8.1 Growth drivers
- 3.8.1.1 Rising digital payments adoption
- 3.8.1.2 Growing adoption of banking-as-a-service platforms
- 3.8.1.3 Increasing focus on customer experience
- 3.8.1.4 Growing revenue diversification opportunities
- 3.8.2 Industry pitfalls & challenges
- 3.8.2.1 Security and fraud risks
- 3.8.2.2 Technical integration complexity
- 3.8.1 Growth drivers
- 3.9 Growth potential analysis
- 3.10 Porter’s analysis
- 3.11 PESTEL analysis
Chapter 4 Competitive Landscape, 2024
- 4.1 Introduction
- 4.2 Company market share analysis
- 4.3 Competitive positioning matrix
- 4.4 Strategic outlook matrix
Chapter 5 Market Estimates & Forecast, By Service, 2021 - 2034 ($Bn)
- 5.1 Key trends
- 5.2 Payment
- 5.3 Insurance
- 5.4 Investment
- 5.5 Lending
- 5.6 Banking
Chapter 6 Market Estimates & Forecast, By Business Model, 2021 - 2034 ($Bn)
- 6.1 Key trends
- 6.2 B2B
- 6.3 B2C
Chapter 7 Market Estimates & Forecast, By End Use, 2021 - 2034 ($Bn)
- 7.1 Key trends
- 7.2 Retail
- 7.3 Healthcare
- 7.4 Logistics
- 7.5 Manufacturing
- 7.6 Travel & entertainment
- 7.7 Others
Chapter 8 Market Estimates & Forecast, By Region, 2021 - 2034 ($Bn)
- 8.1 Key trends
- 8.2 North America
- 8.2.1 U.S.
- 8.2.2 Canada
- 8.3 Europe
- 8.3.1 UK
- 8.3.2 Germany
- 8.3.3 France
- 8.3.4 Spain
- 8.3.5 Italy
- 8.3.6 Russia
- 8.3.7 Nordics
- 8.4 Asia Pacific
- 8.4.1 China
- 8.4.2 India
- 8.4.3 Japan
- 8.4.4 South Korea
- 8.4.5 ANZ
- 8.4.6 Southeast Asia
- 8.5 Latin America
- 8.5.1 Brazil
- 8.5.2 Mexico
- 8.5.3 Argentina
- 8.6 MEA
- 8.6.1 UAE
- 8.6.2 South Africa
- 8.6.3 Saudi Arabia
Chapter 9 Company Profiles
- 9.1 Banxware
- 9.2 Cross River
- 9.3 Cybrid Technology
- 9.4 Finastra
- 9.5 FinBox
- 9.6 Finix
- 9.7 Fluenccy
- 9.8 Flywire
- 9.9 Fortis Payment Systems
- 9.10 Lendflow
- 9.11 Marqeta
- 9.12 Parafin
- 9.13 PayPal
- 9.14 PAYRIX
- 9.15 Stripe
- 9.16 Transcard Payments
- 9.17 TreviPay
- 9.18 Walnut Insurance
- 9.19 Zopa Bank

