
PUBLISHER: Global Market Insights Inc. | PRODUCT CODE: 1667055

PUBLISHER: Global Market Insights Inc. | PRODUCT CODE: 1667055
Europe Stationary Battery Storage Market Opportunity, Growth Drivers, Industry Trend Analysis, and Forecast 2025 - 2034
Europe Stationary Battery Storage Market was valued at USD 45.5 billion in 2024 and is projected to grow at an impressive CAGR of 14.5% from 2025 to 2034. This robust growth is driven by several key factors, including the region's commitment to integrating renewable energy sources, such as wind and solar, into the power grid and its ambitious environmental goals. As countries across Europe make significant strides in decarbonizing their energy sectors, stationary battery storage solutions are essential for balancing supply and demand, ensuring energy security, and enhancing grid reliability. The transition towards cleaner energy is not only a strategic priority for reducing carbon emissions but also a necessary step to future-proof Europe's energy infrastructure against evolving environmental challenges.
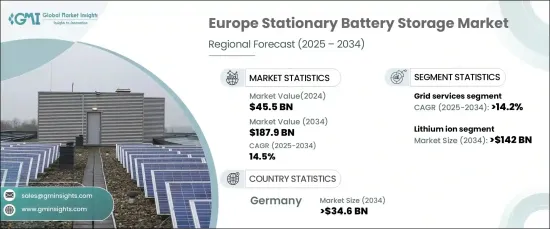
In terms of battery types, the market is primarily segmented into lithium-ion, sodium-sulfur, lead-acid, flow batteries, and others. Among these, the lithium-ion battery segment is expected to generate a staggering USD 142 billion by 2034. This surge in demand for lithium-ion batteries comes as Europe increasingly depends on renewable energy. Lithium-ion technology is gaining traction due to its ability to efficiently store excess energy during peak production periods and release it when generation drops, such as at night or during cloudy days. This capability is particularly valuable for smoothing out the intermittent nature of renewable energy production, ensuring that consumers have a stable and continuous power supply.
| Market Scope | |
|---|---|
| Start Year | 2024 |
| Forecast Year | 2025-2034 |
| Start Value | $45.5 Billion |
| Forecast Value | $187.9 Billion |
| CAGR | 14.5% |
The market also spans various applications, with grid services, behind the meter, and off-grid solutions leading the way. The grid services segment, in particular, is expected to grow at a CAGR of 14.2% through 2034. As renewable energy adoption continues to climb, the need for grid stability becomes increasingly crucial. Lithium-ion battery storage systems are pivotal in this regard, helping maintain a balanced power grid by storing surplus energy and discharging it during times of high demand or when renewable energy generation falters. This capacity for flexibility is driving the adoption of stationary batteries, positioning them as an indispensable element of the region's energy strategy.
Germany stationary battery storage market is poised to generate USD 34.6 billion by 2034, underscoring the country's leadership in renewable energy integration. As one of Europe's most advanced nations in terms of energy transition, Germany's ongoing push to decarbonize its energy grid highlights the pressing need for reliable energy storage solutions. With renewables increasingly contributing to the energy mix, lithium-ion battery systems are becoming a crucial part of Germany's strategy to stabilize the grid and ensure a consistent, renewable-powered energy supply for both residential and commercial sectors.
Table of Contents
Chapter 1 Methodology & Scope
- 1.1 Market definitions
- 1.2 Base estimates & calculations
- 1.3 Forecast calculation
- 1.4 Data sources
- 1.4.1 Primary
- 1.4.2 Secondary
- 1.4.2.1 Paid
- 1.4.2.2 Public
Chapter 2 Industry Insights
- 2.1 Industry ecosystem analysis
- 2.2 Regulatory landscape
- 2.3 Industry impact forces
- 2.3.1 Growth drivers
- 2.3.2 Industry pitfalls & challenges
- 2.4 Growth potential analysis
- 2.5 Porter's analysis
- 2.5.1 Bargaining power of suppliers
- 2.5.2 Bargaining power of buyers
- 2.5.3 Threat of new entrants
- 2.5.4 Threat of substitutes
- 2.6 PESTEL analysis
Chapter 3 Competitive landscape, 2024
- 3.1 Strategic dashboard
- 3.2 Innovation & sustainability landscape
Chapter 4 Market Size and Forecast, By Battery, 2021 – 2034 (USD Million, MW)
- 4.1 Key trends
- 4.2 Lithium ion
- 4.2.1 LFP
- 4.2.2 NMC
- 4.2.3 Others
- 4.3 Sodium sulphur
- 4.4 Lead acid
- 4.5 Flow battery
- 4.6 Others
Chapter 5 Market Size and Forecast, By Application, 2021 – 2034 (USD Million, MW)
- 5.1 Key trends
- 5.2 Grid services
- 5.2.1 Frequency regulation
- 5.2.2 Flexible ramping
- 5.2.3 Black start services
- 5.2.4 Energy shifting & capacity deferral
- 5.2.5 T & D congestion relief
- 5.2.6 Capacity firming
- 5.2.7 Reduced RE curtailment
- 5.2.8 Reduced reliance on diesel gensets
- 5.3 Behind the meter
- 5.3.1 Electricity consumers
- 5.3.2 System operation
- 5.3.3 Mini grids
- 5.4 Off grid
Chapter 6 Market Size and Forecast, By Region, 2021 – 2034 (USD Million, MW)
- 6.1 Key trends
- 6.2 UK
- 6.3 Germany
- 6.4 France
- 6.5 Spain
- 6.6 Italy
Chapter 7 Company Profiles
- 7.1 A123 Systems
- 7.2 BYD Company
- 7.3 CMBlu Energy
- 7.4 CATL
- 7.5 Durapower
- 7.6 Duracell
- 7.7 Exide Technologies
- 7.8 Furukawa Battery
- 7.9 GS Yuasa
- 7.10 HydraRedox
- 7.11 Invinity Energy Systems
- 7.12 Jena Batteries
- 7.13 Johnson Controls
- 7.14 LG Energy Solutions
- 7.15 Lockheed Martin
- 7.16 Panasonic
- 7.17 Samsung SDI
- 7.18 Siemens Energy
- 7.19 Tesla
- 7.20 Toshiba
- 7.21 Volkswagen

