
PUBLISHER: Global Market Insights Inc. | PRODUCT CODE: 1666563

PUBLISHER: Global Market Insights Inc. | PRODUCT CODE: 1666563
Europe Commercial Boiler Market Opportunity, Growth Drivers, Industry Trend Analysis, and Forecast 2025 - 2034
Europe Commercial Boiler Market, valued at USD 6.1 billion in 2024, is set to experience substantial growth, projected to expand at a robust CAGR of 7.1% from 2025 to 2034. This growth is driven by a convergence of factors, including increasingly stringent government policies that prioritize energy-efficient heating solutions and a fast-developing commercial sector. Rising environmental awareness pushes both businesses and governments to adopt more sustainable and eco-friendly technologies. In this evolving landscape, the adoption of advanced and reliable heating systems is becoming a necessity, not only for reducing operational costs but also for complying with stricter environmental regulations.
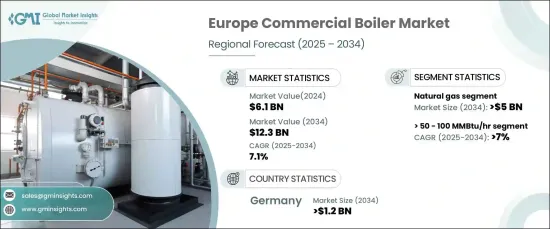
The natural gas-fueled commercial boiler segment is poised for significant growth, expected to generate USD 5 billion by 2034. The rising demand for cleaner, sustainable energy solutions is a major factor behind this shift. With governments imposing stricter carbon reduction mandates, natural gas is increasingly seen as an ideal alternative to traditional heating fuels. The transition is further supported by rising investments in environmentally friendly building projects and a growing preference for systems that can meet regulatory standards for energy efficiency. As the commercial sector transitions to greener technologies, natural gas boilers are becoming more commonplace, ensuring consistent market growth in the coming years.
| Market Scope | |
|---|---|
| Start Year | 2024 |
| Forecast Year | 2025-2034 |
| Start Value | $6.1 Billion |
| Forecast Value | $12.3 Billion |
| CAGR | 7.1% |
The market for >50-100 MMBtu/hr commercial boilers is projected to grow at a steady CAGR of 7% through 2034. The key drivers of this growth include the increasing demand for energy-efficient space and water heating solutions across industries like warehousing and hospitality. Significant investments in the development and modernization of commercial properties, including healthcare facilities, are expected to further drive demand. Moreover, the rise in popularity of eco-friendly, low-emission boilers that incorporate smart technology is accelerating their adoption across the region as businesses look for ways to reduce energy consumption while improving operational efficiency.
Germany commercial boiler market is projected to generate USD 1.2 billion by 2034. This growth is underpinned by the country's strong commitment to energy conservation, in line with regulations aimed at reducing carbon footprints. The adoption of advanced heating solutions is fueled by ongoing initiatives to integrate renewable energy sources into the energy grid. Moreover, the retrofitting and replacement of outdated boiler systems are driving demand, particularly within the healthcare and hospitality sectors, which require high energy efficiency levels.
Table of Contents
Chapter 1 Methodology & Scope
- 1.1 Market scope & definitions
- 1.2 Market estimates & forecast parameters
- 1.3 Forecast calculation
- 1.4 Data sources
- 1.4.1 Primary
- 1.4.2 Secondary
- 1.4.2.1 Paid
- 1.4.2.2 Public
Chapter 2 Industry Insights
- 2.1 Industry ecosystem analysis
- 2.2 Regulatory landscape
- 2.3 Industry impact forces
- 2.3.1 Growth drivers
- 2.3.2 Industry pitfalls & challenges
- 2.4 Growth potential analysis
- 2.5 Porter's analysis
- 2.5.1 Bargaining power of suppliers
- 2.5.2 Bargaining power of buyers
- 2.5.3 Threat of new entrants
- 2.5.4 Threat of substitutes
- 2.6 PESTEL analysis
Chapter 3 Competitive Landscape, 2024
- 3.1 Introduction
- 3.2 Strategic outlook
- 3.3 Innovation & sustainability landscape
Chapter 4 Market Size and Forecast, By Fuel, 2021 – 2034 (Units, MMBTU/hr & USD Million)
- 4.1 Key trends
- 4.2 Natural gas
- 4.3 Oil
- 4.4 Coal
- 4.5 Electric
- 4.6 Others
Chapter 5 Market Size and Forecast, By Capacity, 2021 – 2034 (Units, MMBTU/hr & USD Million)
- 5.1 Key trends
- 5.2 ≤ 0.3 - 2.5 MMBtu/hr
- 5.3 > 2.5 - 10 MMBtu/hr
- 5.4 > 10 - 50 MMBtu/hr
- 5.5 > 50 - 100 MMBtu/hr
- 5.6 > 100 - 250 MMBtu/hr
Chapter 6 Market Size and Forecast, By Technology, 2021 – 2034 (Units, MMBTU/hr & USD Million)
- 6.1 Key trends
- 6.2 Condensing
- 6.3 Non-condensing
Chapter 7 Market Size and Forecast, By Product, 2021 – 2034 (Units, MMBTU/hr & USD Million)
- 7.1 Key trends
- 7.2 Hot water
- 7.3 Steam
Chapter 8 Market Size and Forecast, By Application, 2021 – 2034 (Units, MMBTU/hr & USD Million)
- 8.1 Key trends
- 8.2 Offices
- 8.3 Healthcare facilities
- 8.4 Educational institutions
- 8.5 Lodgings
- 8.6 Retail stores
- 8.7 Others
Chapter 9 Market Size and Forecast, By Country, 2021 – 2034 (Units, MMBTU/hr & USD Million)
- 9.1 Key trends
- 9.2 France
- 9.3 UK
- 9.4 Poland
- 9.5 Italy
- 9.6 Spain
- 9.7 Austria
- 9.8 Germany
- 9.9 Sweden
- 9.10 Russia
Chapter 10 Company Profiles
- 10.1 A.O. Smith
- 10.2 Ariston Holding
- 10.3 Babcock & Wilcox Enterprises
- 10.4 Babcock Wanson
- 10.5 Bosch Thermotechnology
- 10.6 Bradford White Corporation
- 10.7 BURNHAM COMMERCIAL BOILERS
- 10.8 Clayton Industries
- 10.9 Cleaver-Brooks
- 10.10 FERROLI
- 10.11 Fonderie Sime
- 10.12 FONDITAL
- 10.13 Fulton
- 10.14 Hurst Boiler & Welding
- 10.15 Thermal Solutions
- 10.16 Vaillant Group
- 10.17 VIESSMANN
- 10.18 Weil-McLain

