
PUBLISHER: Global Market Insights Inc. | PRODUCT CODE: 1782146

PUBLISHER: Global Market Insights Inc. | PRODUCT CODE: 1782146
High Voltage Electric Capacitor Market Opportunity, Growth Drivers, Industry Trend Analysis, and Forecast 2025 - 2034
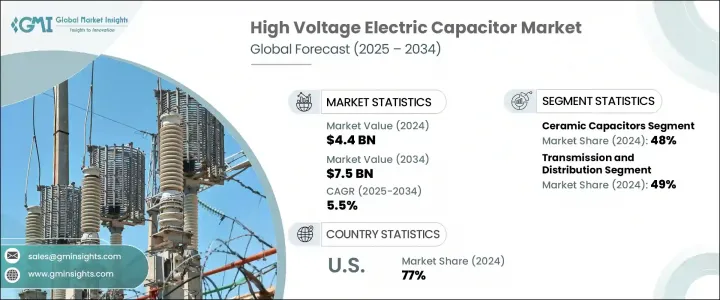
The Global High Voltage Electric Capacitor Market was valued at USD 4.4 billion in 2024 and is estimated to grow at a CAGR of 5.5% to reach USD 7.5 billion by 2034. This market is gaining traction worldwide due to the growing reliance on these components for a wide range of uses, including power transmission, distribution systems, energy storage, and power factor correction. High-voltage capacitors have become indispensable for ensuring consistent voltage regulation, enhancing grid efficiency, and minimizing transmission losses. As power networks increasingly integrate renewable sources like solar, wind, and hydro, demand for advanced capacitor solutions is accelerating. These devices offer high durability, heat resistance, and elevated voltage performance, making them ideal for demanding commercial and industrial environments operating beyond 105°C.
Manufacturers are also focusing on compact designs that deliver superior efficiency in space-constrained and extreme operational conditions. These innovations aim to reduce the overall footprint of electrical systems without compromising performance, allowing for greater flexibility in system architecture and layout. Compact high voltage capacitors are particularly beneficial in modular grid components, mobile substations, offshore platforms, and other high-demand settings where space and thermal management are critical. By optimizing size-to-capacitance ratios, companies are making it easier for engineers and utility providers to integrate these solutions into advanced power electronics and renewable installations.
| Market Scope | |
|---|---|
| Start Year | 2024 |
| Forecast Year | 2025-2034 |
| Start Value | $4.4 Billion |
| Forecast Value | $7.5 Billion |
| CAGR | 5.5% |
The film capacitors segment will reach USD 2.1 billion by 2034, growing at a 5.4% CAGR. Their widespread use is attributed to their long service life, strong thermal stability, and low inductance, making them highly reliable for filtering, power correction, and surge absorption in energy electronics. As energy transition trends continue, film capacitors are becoming a critical component in managing power flow in clean energy systems, especially within inverters and converters for solar and wind grid integration.
The transmission and distribution segment held a 49% share in 2024 and is forecast to grow at a CAGR of 5.2% through 2034. With the growing focus on grid efficiency and consistent power delivery over long distances, high-performance capacitors are in high demand. These components play a vital role in ensuring voltage stability across vast transmission infrastructures, especially in developing regions and nations expanding ultra-high voltage (UHV) and extra-high voltage (EHV) systems to support increasing electricity needs and wide territorial spans.
U.S. High Voltage Electric Capacitor Market held 77% share in 2024, generating USD 650 million. Growth is primarily driven by ongoing efforts to modernize the aging electric grid and increase the integration of cleaner energy sources. Utilities across the U.S. are investing heavily in robust capacitor technologies to manage reactive power, improve voltage consistency, and enhance grid resilience in response to fluctuating energy loads.
Key companies active in the market include Kemet, Murata, Panasonic, ABB, and Cornell Dubilier. To enhance their market positioning, companies in the high voltage electric capacitor sector are focusing on product innovation, strategic partnerships, and geographic expansion. Emphasis is being placed on developing advanced capacitor technologies with higher temperature resistance, better energy density, and longer service life to support applications in renewable integration and smart grid modernization. Firms are also investing in R&D to manufacture space-efficient, high-performance products that meet evolving customer demands in industrial and utility sectors. Establishing regional manufacturing units and service centers allows for reduced delivery times and localized support.
Table of Contents
Chapter 1 Methodology & Scope
- 1.1 Market definitions
- 1.2 Base estimates & calculations
- 1.3 Forecast calculation
- 1.4 Data sources
- 1.4.1 Primary
- 1.4.2 Secondary
- 1.4.2.1 Paid
- 1.4.2.2 Public
Chapter 2 Executive Summary
- 2.1 Industry synopsis, 2021 - 2034
Chapter 3 Industry Insights
- 3.1 Industry ecosystem analysis
- 3.2 Regulatory landscape
- 3.3 Industry impact forces
- 3.3.1 Growth drivers
- 3.3.2 Industry pitfalls & challenges
- 3.4 Growth potential analysis
- 3.5 Porter's analysis
- 3.5.1 Bargaining power of suppliers
- 3.5.2 Bargaining power of buyers
- 3.5.3 Threat of new entrants
- 3.5.4 Threat of substitutes
- 3.6 PESTEL analysis
Chapter 4 Competitive Landscape, 2025
- 4.1 Introduction
- 4.2 Company market share analysis, 2024
- 4.3 Strategy dashboard
- 4.4 Strategic initiative
- 4.5 Competitive benchmarking
- 4.6 Innovation & technology landscape
Chapter 5 Market Size and Forecast, By Material, 2021 - 2034, ('000 Units and USD Billion)
- 5.1 Key trends
- 5.2 Film capacitors
- 5.3 Ceramic capacitors
- 5.4 Electrolytic capacitors
- 5.5 Others
Chapter 6 Market Size and Forecast, By End Use, 2021 - 2034, ('000 Units and USD Billion)
- 6.1 Key trends
- 6.2 Consumer electronics
- 6.3 Automotive
- 6.4 Communication & technology
- 6.5 Transmission & distribution
- 6.6 Others
Chapter 7 Market Size and Forecast, By Region, 2021 - 2034, ('000 Units and USD Billion)
- 7.1 Key trends
- 7.2 North America
- 7.2.1 U.S.
- 7.2.2 Canada
- 7.2.3 Mexico
- 7.3 Europe
- 7.3.1 UK
- 7.3.2 France
- 7.3.3 Germany
- 7.3.4 Italy
- 7.3.5 Austria
- 7.4 Asia Pacific
- 7.4.1 China
- 7.4.2 Japan
- 7.4.3 India
- 7.4.4 South Korea
- 7.4.5 Australia
- 7.5 Middle East & Africa
- 7.5.1 Saudi Arabia
- 7.5.2 UAE
- 7.5.3 Qatar
- 7.5.4 Kuwait
- 7.6 Latin America
- 7.6.1 Brazil
- 7.6.2 Argentina
- 7.6.3 Chile
Chapter 8 Company Profiles
- 8.1 ABB
- 8.2 Cornell Dubilier
- 8.3 Elna
- 8.4 Havells
- 8.5 Kemet
- 8.6 Kyocera AVX
- 8.7 Murata Manufacturing
- 8.8 Panasonic
- 8.9 Samsung Electro-Mechanics
- 8.10 Schneider Electric
- 8.11 Siemens
- 8.12 Taiyo Yuden
- 8.13 TDK
- 8.14 Vishay Intertechnology

