Picture
SEARCH
What are you looking for?
Need help finding what you are looking for? Contact Us
Compare

PUBLISHER: Global Market Insights Inc. | PRODUCT CODE: 1400527

Cover Image

PUBLISHER: Global Market Insights Inc. | PRODUCT CODE: 1400527

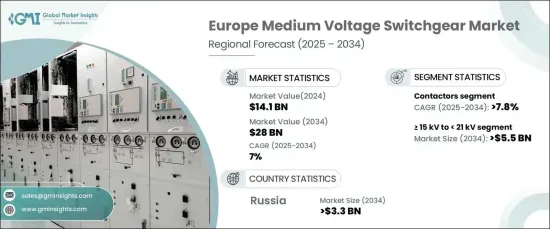
Europe Medium Voltage Switchgear Market Size - By Component, By Insulation, By End Use, Application, Voltage & Forecast, 2023 - 2032

PUBLISHED:
PAGES: 330 Pages
DELIVERY TIME: 2-3 business days
SELECT AN OPTION
PDF & Excel (Single User License)
USD 4850
PDF & Excel (Multi User License)
USD 5350
PDF & Excel (Enterprise User License)
USD 7350

Add to Cart

Europe medium voltage switchgear market size is projected to expand at 7.4% CAGR from 2023 to 2032. The increasing focus on renewable energy sources and the higher integration of smart grids is fueling the demand for medium voltage switchgears in electrical networks across the region.

The surging adoption of digital switchgear and intelligent monitoring systems is leading to enhanced reliability and performance. The growing emphasis on infrastructure development is resulting in the replacement of aging electrical infrastructure. For instance, in May 2022, ABB inaugurated Europe's first Climatic Test Chamber, designed for testing energized medium voltage (MV) switchgear for simulating the harsh climatic site conditions, ranging from temperatures as low as minus 50 °C to highs of up to 80 °C. The influx of stringent environmental regulations and the growing need for efficient power distribution will also escalate the product demand.

The Europe medium voltage switchgear industry is segregated into voltage, component, insulation, end-use, application, and region.

With respect to component, the industry value from the circuit breakers segment is anticipated to rise at appreciable CAGR between 2023 and 2032. This is attributed to the increasing emphasis on grid reliability and the higher adoption of circuit breakers to ensure efficient power distribution. The ongoing technological advancements and the rising need for effective equipment protection will also amplify the demand for circuit breakers across the region.

Europe medium voltage switchgear industry share from the oil insulation segment is projected to increase at significant CAGR between 2023 and 2032. This is owing to the superior dielectric properties and effectiveness of oil insulation in ensuring reliable electrical performance. The surging demand for robust and efficient switchgear solutions in various industries will further fuel the product adoption in the region.

Regionally, the U.K. medium voltage switchgear industry size is projected to expand at rapid pace through 2032. The growth can be attributed to the increasing investments in renewable energy projects, grid modernization initiatives, and the rising need for efficient power distribution infrastructure. The regulatory support for clean energy and the higher advancements in switchgear technologies will also drive the regional market expansion.

Product Code: 7335

Table of Contents

Chapter 1 Methodology & Scope

  • 1.1 Market definitions
  • 1.2 Base estimates & calculations
  • 1.3 Forecast calculation
  • 1.4 Data sources
    • 1.4.1 Primary
    • 1.4.2 Secondary
      • 1.4.2.1 Paid
      • 1.4.2.2 Public

Chapter 2 Europe Medium Voltage Switchgear Industry Insights

  • 2.1 Industry ecosystem analysis
    • 2.1.1 Vendor matrix
  • 2.2 Regulatory landscape
  • 2.3 Industry impact forces
    • 2.3.1 Growth drivers
    • 2.3.2 Industry pitfalls & challenges
  • 2.4 Growth potential analysis
  • 2.5 Porter's Analysis
    • 2.5.1 Bargaining power of suppliers
    • 2.5.2 Bargaining power of buyers
    • 2.5.3 Threat of new entrants
    • 2.5.4 Threat of substitutes
  • 2.6 PESTEL Analysis

Chapter 3 Competitive Benchmarking

  • 3.1 Innovation & sustainability landscape
  • 3.2 Competitive landscape, 2022
    • 3.2.1 Strategic dashboard

Chapter 4 Europe Medium Voltage Switchgear Market, By Voltage ('000 Units, USD Million)

  • 4.1 Key voltage trends
  • 4.2 ≥ 3 kV to < 9 kV
  • 4.3 ≥ 9 kV to < 15 kV
  • 4.4 ≥ 15 kV to < 21 kV
  • 4.5 ≥ 21 kV to < 27 kV
  • 4.6 ≥ 27 kV to < 33 kV
  • 4.7 ≥ 33 kV

Chapter 5 Europe Medium Voltage Switchgear Market, By Component ('000 Units, USD Million)

  • 5.1 Key component trends
  • 5.2 Circuit Breakers
  • 5.3 Contactors
  • 5.4 Switches & Disconnector
  • 5.5 Fuses
  • 5.6 Others

Chapter 6 Europe Medium Voltage Switchgear Market, By Insulation ('000 Units, USD Million)

  • 6.1 Key insulation trends
  • 6.2 Air
  • 6.3 Gas
  • 6.4 Oil
  • 6.5 Vacuum
  • 6.6 Others

Chapter 7 Europe Medium Voltage Switchgear Market, By End Use ('000 Units, USD Million)

  • 7.1 Key end use trends
  • 7.2 Power stations
  • 7.3 Transformer substations
  • 7.4 Local electricity supply
  • 7.5 Others

Chapter 8 Europe Medium Voltage Switchgear Market, By Application ('000 Units, USD Million)

  • 8.1 Key application trends
  • 8.2 Residential
  • 8.3 Commercial
  • 8.4 Industrial
  • 8.5 Utility

Chapter 9 Europe Medium Voltage Switchgear Market, By Country ('000 Units, USD Million)

  • 9.1 Key country trends
  • 9.2 UK
  • 9.3 Germany
  • 9.4 France
  • 9.5 Russia
  • 9.6 Italy
  • 9.7 Spain

Chapter 10 Company Profiles

  • 10.1 ABB
  • 10.2 Siemens
  • 10.3 General Electric
  • 10.4 Mitsubishi Electric Corporation
  • 10.5 Schneider Electric
  • 10.6 Ormazabal
  • 10.7 Bharat Heavy Electricals Limited
  • 10.8 CG Power & Industrial Solutions Ltd.
  • 10.9 CHINT Group
  • 10.10 Eaton
  • 10.11 HYOSUNG HEAVY INDUSTRIES
  • 10.12 Lucy Group Ltd.
  • 10.13 HD Hyundai Electric Co., Ltd.
  • 10.14 Powell Industries
  • 10.15 Toshiba Infrastructure Systems & Solutions Corporation
Product Code: 7335

Data Tables

  • TABLE 1 Industry impact forces
  • TABLE 2 Europe market from ≥ 3 kV to < 9 kV, 2019 - 2022 (Volume & Revenue)
  • TABLE 3 Europe market from ≥ 3 kV to < 9 kV, 2023 - 2027 (Volume & Revenue)
  • TABLE 4 Europe market from ≥ 3 kV to < 9 kV, 2028 - 2032 (Volume & Revenue)
  • TABLE 5 Europe market from ≥ 3 kV to < 9 kV, by country, 2019 - 2022 ('000 Units)
  • TABLE 6 Europe market from ≥ 3 kV to < 9 kV, by country, 2023 - 2027 ('000 Units)
  • TABLE 7 Europe market from ≥ 3 kV to < 9 kV, by country, 2028 - 2032 ('000 Units)
  • TABLE 8 Europe market from ≥ 3 kV to < 9 kV, by country, 2019 - 2022 (USD Million)
  • TABLE 9 Europe market from ≥ 3 kV to < 9 kV, by country, 2023 - 2027 (USD Million)
  • TABLE 10 Europe market from ≥ 3 kV to < 9 kV, by country, 2028 - 2032 (USD Million)
  • TABLE 11 Europe market from ≥ 9 kV to < 15 kV, 2019 - 2022 (Volume & Revenue)
  • TABLE 12 Europe market from ≥ 9 kV to < 15 kV, 2023 - 2027 (Volume & Revenue)
  • TABLE 13 Europe market from ≥ 9 kV to < 15 kV, 2028 - 2032 (Volume & Revenue)
  • TABLE 14 Europe market from ≥ 9 kV to < 15 kV, by country, 2019 - 2022 ('000 Units)
  • TABLE 15 Europe market from ≥ 9 kV to < 15 kV, by country, 2023 - 2027 ('000 Units)
  • TABLE 16 Europe market from ≥ 9 kV to < 15 kV, by country, 2028 - 2032 ('000 Units)
  • TABLE 17 Europe market from ≥ 9 kV to < 15 kV, by country, 2019 - 2022 (USD Million)
  • TABLE 18 Europe market from ≥ 9 kV to < 15 kV, by country, 2023 - 2027 (USD Million)
  • TABLE 19 Europe market from ≥ 9 kV to < 15 kV, by country, 2028 - 2032 (USD Million)
  • TABLE 20 Europe market from ≥ 15 kV to < 21 kV, 2019 - 2022 (Volume & Revenue)
  • TABLE 21 Europe market from ≥ 15 kV to < 21 kV, 2023 - 2027 (Volume & Revenue)
  • TABLE 22 Europe market from ≥ 15 kV to < 21 kV, 2028 - 2032 (Volume & Revenue)
  • TABLE 23 Europe market from ≥ 15 kV to < 21 kV, by country, 2019 - 2022 ('000 Units)
  • TABLE 24 Europe market from ≥ 15 kV to < 21 kV, by country, 2023 - 2027 ('000 Units)
  • TABLE 25 Europe market from ≥ 15 kV to < 21 kV, by country, 2028 - 2032 ('000 Units)
  • TABLE 26 Europe market from ≥ 15 kV to < 21 kV, by country, 2019 - 2022 (USD Million)
  • TABLE 27 Europe market from ≥ 15 kV to < 21 kV, by country, 2023 - 2027 (USD Million)
  • TABLE 28 Europe market from ≥ 15 kV to < 21 kV, by country, 2028 - 2032 (USD Million)
  • TABLE 29 Europe market from ≥ 21 kV to < 27 kV, 2019 - 2022 (Volume & Revenue)
  • TABLE 30 Europe market from ≥ 21 kV to < 27 kV, 2023 - 2027 (Volume & Revenue)
  • TABLE 31 Europe market from ≥ 21 kV to < 27 kV, 2028 - 2032 (Volume & Revenue)
  • TABLE 32 Europe market from ≥ 21 kV to < 27 kV, by country, 2019 - 2022 ('000 Units)
  • TABLE 33 Europe market from ≥ 21 kV to < 27 kV, by country, 2023 - 2027 ('000 Units)
  • TABLE 34 Europe market from ≥ 21 kV to < 27 kV, by country, 2028 - 2032 ('000 Units)
  • TABLE 35 Europe market from ≥ 21 kV to < 27 kV, by country, 2019 - 2022 (USD Million)
  • TABLE 36 Europe market from ≥ 21 kV to < 27 kV, by country, 2023 - 2027 (USD Million)
  • TABLE 37 Europe market from ≥ 21 kV to < 27 kV, by country, 2028 - 2032 (USD Million)
  • TABLE 38 Europe market from ≥ 27 kV to < 33 kV, 2019 - 2022 (Volume & Revenue)
  • TABLE 39 Europe market from ≥ 27 kV to < 33 kV, 2023 - 2027 (Volume & Revenue)
  • TABLE 40 Europe market from ≥ 27 kV to < 33 kV, 2028 - 2032 (Volume & Revenue)
  • TABLE 41 Europe market from ≥ 27 kV to < 33 kV, by country, 2019 - 2022 ('000 Units)
  • TABLE 42 Europe market from ≥ 27 kV to < 33 kV, by country, 2023 - 2027 ('000 Units)
  • TABLE 43 Europe market from ≥ 27 kV to < 33 kV, by country, 2028 - 2032 ('000 Units)
  • TABLE 44 Europe market from ≥ 27 kV to < 33 kV, by country, 2019 - 2022 (USD Million)
  • TABLE 45 Europe market from ≥ 27 kV to < 33 kV, by country, 2023 - 2027 (USD Million)
  • TABLE 46 Europe market from ≥ 27 kV to < 33 kV, by country, 2028 - 2032 (USD Million)
  • TABLE 47 Europe market from ≥ 33 kV, 2019 - 2022 (Volume & Revenue)
  • TABLE 48 Europe market from ≥ 33 kV, 2023 - 2027 (Volume & Revenue)
  • TABLE 49 Europe market from ≥ 33 kV, 2028 - 2032 (Volume & Revenue)
  • TABLE 50 Europe market from ≥ 33 kV, by country, 2019 - 2022 ('000 Units)
  • TABLE 51 Europe market from ≥ 33 kV, by country, 2023 - 2027 ('000 Units)
  • TABLE 52 Europe market from ≥ 33 kV, by country, 2028 - 2032 ('000 Units)
  • TABLE 53 Europe market from ≥ 33 kV, by country, 2019 - 2022 (USD Million)
  • TABLE 54 Europe market from ≥ 33 kV, by country, 2023 - 2027 (USD Million)
  • TABLE 55 Europe market from ≥ 33 kV, by country, 2028 - 2032 (USD Million)
  • TABLE 56 Europe market from circuit breakers, 2019 - 2022 (Volume & Revenue)
  • TABLE 57 Europe market from circuit breakers, 2023 - 2027 (Volume & Revenue)
  • TABLE 58 Europe market from circuit breakers, 2028 - 2032 (Volume & Revenue)
  • TABLE 59 Europe market from circuit breakers, by country, 2019 - 2022 ('000 Units)
  • TABLE 60 Europe market from circuit breakers, by country, 2023 - 2027 ('000 Units)
  • TABLE 61 Europe market from circuit breakers, by country, 2028 - 2032 ('000 Units)
  • TABLE 62 Europe market from circuit breakers, by country, 2019 - 2022 (USD Million)
  • TABLE 63 Europe market from circuit breakers, by country, 2023 - 2027 (USD Million)
  • TABLE 64 Europe market from circuit breakers, by country, 2028 - 2032 (USD Million)
  • TABLE 65 Europe market from contactors, 2019 - 2022 (Volume & Revenue)
  • TABLE 66 Europe market from contactors, 2023 - 2027 (Volume & Revenue)
  • TABLE 67 Europe market from contactors, 2028 - 2032 (Volume & Revenue)
  • TABLE 68 Europe market from contactors, by country, 2019 - 2022 ('000 Units)
  • TABLE 69 Europe market from contactors, by country, 2023 - 2027 ('000 Units)
  • TABLE 70 Europe market from contactors, by country, 2028 - 2032 ('000 Units)
  • TABLE 71 Europe market from contactors, by country, 2019 - 2022 (USD Million)
  • TABLE 72 Europe market from contactors, by country, 2023 - 2027 (USD Million)
  • TABLE 73 Europe market from contactors, by country, 2028 - 2032 (USD Million)
  • TABLE 74 Europe market from switches & disconnector, 2019 - 2022 (Volume & Revenue)
  • TABLE 75 Europe market from switches & disconnector, 2023 - 2027 (Volume & Revenue)
  • TABLE 76 Europe market from switches & disconnector, 2028 - 2032 (Volume & Revenue)
  • TABLE 77 Europe market from switches & disconnector, by country, 2019 - 2022 ('000 Units)
  • TABLE 78 Europe market from switches & disconnector, by country, 2023 - 2027 ('000 Units)
  • TABLE 79 Europe market from switches & disconnector, by country, 2028 - 2032 ('000 Units)
  • TABLE 80 Europe market from switches & disconnector, by country, 2019 - 2022 (USD Million)
  • TABLE 81 Europe market from switches & disconnector, by country, 2023 - 2027 (USD Million)
  • TABLE 82 Europe market from switches & disconnector, by country, 2028 - 2032 (USD Million)
  • TABLE 83 Europe market from fuses, 2019 - 2022 (Volume & Revenue)
  • TABLE 84 Europe market from fuses, 2023 - 2027 (Volume & Revenue)
  • TABLE 85 Europe market from fuses, 2028 - 2032 (Volume & Revenue)
  • TABLE 86 Europe market from fuses, by country, 2019 - 2022 ('000 Units)
  • TABLE 87 Europe market from fuses, by country, 2023 - 2027 ('000 Units)
  • TABLE 88 Europe market from fuses, by country, 2028 - 2032 ('000 Units)
  • TABLE 89 Europe market from fuses, by country, 2019 - 2022 (USD Million)
  • TABLE 90 Europe market from fuses, by country, 2023 - 2027 (USD Million)
  • TABLE 91 Europe market from fuses, by country, 2028 - 2032 (USD Million)
  • TABLE 92 Europe market from others, 2019 - 2022 (Volume & Revenue)
  • TABLE 93 Europe market from others, 2023 - 2027 (Volume & Revenue)
  • TABLE 94 Europe market from others, 2028 - 2032 (Volume & Revenue)
  • TABLE 95 Europe market from others, by country, 2019 - 2022 ('000 Units)
  • TABLE 96 Europe market from others, by country, 2023 - 2027 ('000 Units)
  • TABLE 97 Europe market from others, by country, 2028 - 2032 ('000 Units)
  • TABLE 98 Europe market from others, by country, 2019 - 2022 (USD Million)
  • TABLE 99 Europe market from others, by country, 2023 - 2027 (USD Million)
  • TABLE 100 Europe market from others, by country, 2028 - 2032 (USD Million)
  • TABLE 101 Europe market from air, 2019 - 2022 (Volume & Revenue)
  • TABLE 102 Europe market from air, 2023 - 2027 (Volume & Revenue)
  • TABLE 103 Europe market from air, 2028 - 2032 (Volume & Revenue)
  • TABLE 104 Europe market from air, by country, 2019 - 2022 ('000 Units)
  • TABLE 105 Europe market from air, by country, 2023 - 2027 ('000 Units)
  • TABLE 106 Europe market from air, by country, 2028 - 2032 ('000 Units)
  • TABLE 107 Europe market from air, by country, 2019 - 2022 (USD Million)
  • TABLE 108 Europe market from air, by country, 2023 - 2027 (USD Million)
  • TABLE 109 Europe market from air, by country, 2028 - 2032 (USD Million)
  • TABLE 110 Europe market from gas, 2019 - 2022 (Volume & Revenue)
  • TABLE 111 Europe market from gas, 2023 - 2027 (Volume & Revenue)
  • TABLE 112 Europe market from gas, 2028 - 2032 (Volume & Revenue)
  • TABLE 113 Europe market from gas, by country, 2019 - 2022 ('000 Units)
  • TABLE 114 Europe market from gas, by country, 2023 - 2027 ('000 Units)
  • TABLE 115 Europe market from gas, by country, 2028 - 2032 ('000 Units)
  • TABLE 116 Europe market from gas, by country, 2019 - 2022 (USD Million)
  • TABLE 117 Europe market from gas, by country, 2023 - 2027 (USD Million)
  • TABLE 118 Europe market from gas, by country, 2028 - 2032 (USD Million)
  • TABLE 119 Europe market from oil, 2019 - 2022 (Volume & Revenue)
  • TABLE 120 Europe market from oil, 2023 - 2027 (Volume & Revenue)
  • TABLE 121 Europe market from oil, 2028 - 2032 (Volume & Revenue)
  • TABLE 122 Europe market from oil, by country, 2019 - 2022 ('000 Units)
  • TABLE 123 Europe market from oil, by country, 2023 - 2027 ('000 Units)
  • TABLE 124 Europe market from oil, by country, 2028 - 2032 ('000 Units)
  • TABLE 125 Europe market from oil, by country, 2019 - 2022 (USD Million)
  • TABLE 126 Europe market from oil, by country, 2023 - 2027 (USD Million)
  • TABLE 127 Europe market from oil, by country, 2028 - 2032 (USD Million)
  • TABLE 128 Europe market from vacuum, 2019 - 2022 (Volume & Revenue)
  • TABLE 129 Europe market from vacuum, 2023 - 2027 (Volume & Revenue)
  • TABLE 130 Europe market from vacuum, 2028 - 2032 (Volume & Revenue)
  • TABLE 131 Europe market from vacuum, by country, 2019 - 2022 ('000 Units)
  • TABLE 132 Europe market from vacuum, by country, 2023 - 2027 ('000 Units)
  • TABLE 133 Europe market from vacuum, by country, 2028 - 2032 ('000 Units)
  • TABLE 134 Europe market from vacuum, by country, 2019 - 2022 (USD Million)
  • TABLE 135 Europe market from vacuum, by country, 2023 - 2027 (USD Million)
  • TABLE 136 Europe market from vacuum, by country, 2028 - 2032 (USD Million)
  • TABLE 137 Europe market from others, 2019 - 2022 (Volume & Revenue)
  • TABLE 138 Europe market from others, 2023 - 2027 (Volume & Revenue)
  • TABLE 139 Europe market from others, 2028 - 2032 (Volume & Revenue)
  • TABLE 140 Europe market from others, by country, 2019 - 2022 ('000 Units)
  • TABLE 141 Europe market from others, by country, 2023 - 2027 ('000 Units)
  • TABLE 142 Europe market from others, by country, 2028 - 2032 ('000 Units)
  • TABLE 143 Europe market from others, by country, 2019 - 2022 (USD Million)
  • TABLE 144 Europe market from others, by country, 2023 - 2027 (USD Million)
  • TABLE 145 Europe market from others, by country, 2028 - 2032 (USD Million)
  • TABLE 146 Europe market from power stations, 2019 - 2022 (Volume & Revenue)
  • TABLE 147 Europe market from power stations, 2023 - 2027 (Volume & Revenue)
  • TABLE 148 Europe market from power stations, 2028 - 2032 (Volume & Revenue)
  • TABLE 149 Europe market from power stations, by country, 2019 - 2022 ('000 Units)
  • TABLE 150 Europe market from power stations, by country, 2023 - 2027 ('000 Units)
  • TABLE 151 Europe market from power stations, by country, 2028 - 2032 ('000 Units)
  • TABLE 152 Europe market from power stations, by country, 2019 - 2022 (USD Million)
  • TABLE 153 Europe market from power stations, by country, 2023 - 2027 (USD Million)
  • TABLE 154 Europe market from power stations, by country, 2028 - 2032 (USD Million)
  • TABLE 155 Europe market from transformer substations, 2019 - 2022 (Volume & Revenue)
  • TABLE 156 Europe market from transformer substations, 2023 - 2027 (Volume & Revenue)
  • TABLE 157 Europe market from transformer substations, 2028 - 2032 (Volume & Revenue)
  • TABLE 158 Europe market from transformer substations, by country, 2019 - 2022 ('000 Units)
  • TABLE 159 Europe market from transformer substations, by country, 2023 - 2027 ('000 Units)
  • TABLE 160 Europe market from transformer substations, by country, 2028 - 2032 ('000 Units)
  • TABLE 161 Europe market from transformer substations, by country, 2019 - 2022 (USD Million)
  • TABLE 162 Europe market from transformer substations, by country, 2023 - 2027 (USD Million)
  • TABLE 163 Europe market from transformer substations, by country, 2028 - 2032 (USD Million)
  • TABLE 164 Europe market from local electricity supply, 2019 - 2022 (Volume & Revenue)
  • TABLE 165 Europe market from local electricity supply, 2023 - 2027 (Volume & Revenue)
  • TABLE 166 Europe market from local electricity supply, 2028 - 2032 (Volume & Revenue)
  • TABLE 167 Europe market from local electricity supply, by country, 2019 - 2022 ('000 Units)
  • TABLE 168 Europe market from local electricity supply, by country, 2023 - 2027 ('000 Units)
  • TABLE 169 Europe market from local electricity supply, by country, 2028 - 2032 ('000 Units)
  • TABLE 170 Europe market from local electricity supply, by country, 2019 - 2022 (USD Million)
  • TABLE 171 Europe market from local electricity supply, by country, 2023 - 2027 (USD Million)
  • TABLE 172 Europe market from local electricity supply, by country, 2028 - 2032 (USD Million)
  • TABLE 173 Europe market from others, 2019 - 2022 (Volume & Revenue)
  • TABLE 174 Europe market from others, 2023 - 2027 (Volume & Revenue)
  • TABLE 175 Europe market from others, 2028 - 2032 (Volume & Revenue)
  • TABLE 176 Europe market from others, by country, 2019 - 2022 ('000 Units)
  • TABLE 177 Europe market from others, by country, 2023 - 2027 ('000 Units)
  • TABLE 178 Europe market from others, by country, 2028 - 2032 ('000 Units)
  • TABLE 179 Europe market from others, by country, 2019 - 2022 (USD Million)
  • TABLE 180 Europe market from others, by country, 2023 - 2027 (USD Million)
  • TABLE 181 Europe market from others, by country, 2028 - 2032 (USD Million)
  • TABLE 182 Europe market from residential, 2019 - 2022 (Volume & Revenue)
  • TABLE 183 Europe market from residential, 2023 - 2027 (Volume & Revenue)
  • TABLE 184 Europe market from residential, 2028 - 2032 (Volume & Revenue)
  • TABLE 185 Europe market from residential, by country, 2019 - 2022 ('000 Units)
  • TABLE 186 Europe market from residential, by country, 2023 - 2027 ('000 Units)
  • TABLE 187 Europe market from residential, by country, 2028 - 2032 ('000 Units)
  • TABLE 188 Europe market from residential, by country, 2019 - 2022 (USD Million)
  • TABLE 189 Europe market from residential, by country, 2023 - 2027 (USD Million)
  • TABLE 190 Europe market from residential, by country, 2028 - 2032 (USD Million)
  • TABLE 191 Europe market from commercial, 2019 - 2022 (Volume & Revenue)
  • TABLE 192 Europe market from commercial, 2023 - 2027 (Volume & Revenue)
  • TABLE 193 Europe market from commercial, 2028 - 2032 (Volume & Revenue)
  • TABLE 194 Europe market from commercial, by country, 2019 - 2022 ('000 Units)
  • TABLE 195 Europe market from commercial, by country, 2023 - 2027 ('000 Units)
  • TABLE 196 Europe market from commercial, by country, 2028 - 2032 ('000 Units)
  • TABLE 197 Europe market from commercial, by country, 2019 - 2022 (USD Million)
  • TABLE 198 Europe market from commercial, by country, 2023 - 2027 (USD Million)
  • TABLE 199 Europe market from commercial, by country, 2028 - 2032 (USD Million)
  • TABLE 200 Europe market from industrial, 2019 - 2022 (Volume & Revenue)
  • TABLE 201 Europe market from industrial, 2023 - 2027 (Volume & Revenue)
  • TABLE 202 Europe market from industrial, 2028 - 2032 (Volume & Revenue)
  • TABLE 203 Europe market from industrial, by country, 2019 - 2022 ('000 Units)
  • TABLE 204 Europe market from industrial, by country, 2023 - 2027 ('000 Units)
  • TABLE 205 Europe market from industrial, by country, 2028 - 2032 ('000 Units)
  • TABLE 206 Europe market from industrial, by country, 2019 - 2022 (USD Million)
  • TABLE 207 Europe market from industrial, by country, 2023 - 2027 (USD Million)
  • TABLE 208 Europe market from industrial, by country, 2028 - 2032 (USD Million)
  • TABLE 209 Europe market from utility, 2019 - 2022 (Volume & Revenue)
  • TABLE 210 Europe market from utility, 2023 - 2027 (Volume & Revenue)
  • TABLE 211 Europe market from utility, 2028 - 2032 (Volume & Revenue)
  • TABLE 212 Europe market from utility, by country, 2019 - 2022 ('000 Units)
  • TABLE 213 Europe market from utility, by country, 2023 - 2027 ('000 Units)
  • TABLE 214 Europe market from utility, by country, 2028 - 2032 ('000 Units)
  • TABLE 215 Europe market from utility, by country, 2019 - 2022 (USD Million)
  • TABLE 216 Europe market from utility, by country, 2023 - 2027 (USD Million)
  • TABLE 217 Europe market from utility, by country, 2028 - 2032 (USD Million)
  • TABLE 218 UK market, 2019 - 2022 (Volume & Revenue)
  • TABLE 219 UK market, 2023 - 2027 (Volume & Revenue)
  • TABLE 220 UK market, 2028 - 2032 (Volume & Revenue)
  • TABLE 221 UK market by voltage, 2019 - 2022 ('000 Units)
  • TABLE 222 UK market by voltage, 2023 - 2027 ('000 Units)
  • TABLE 223 UK market by voltage, 2028 - 2032 ('000 Units)
  • TABLE 224 UK market by voltage, 2019 - 2022 (USD Million)
  • TABLE 225 UK market by voltage, 2023 - 2027 (USD Million)
  • TABLE 226 UK market by voltage, 2028 - 2032 (USD Million)
  • TABLE 227 UK market by component, 2019 - 2022 ('000 Units)
  • TABLE 228 UK market by component, 2023 - 2027 ('000 Units)
  • TABLE 229 UK market by component, 2028 - 2032 ('000 Units)
  • TABLE 230 UK market by component, 2019 - 2022 (USD Million)
  • TABLE 231 UK market by component, 2023 - 2027 (USD Million)
  • TABLE 232 UK market by component, 2028 - 2032 (USD Million)
  • TABLE 233 UK market by insulation, 2019 - 2022 ('000 Units)
  • TABLE 234 UK market by insulation, 2023 - 2027 ('000 Units)
  • TABLE 235 UK market by insulation, 2028 - 2032 ('000 Units)
  • TABLE 236 UK market by insulation, 2019 - 2022 (USD Million)
  • TABLE 237 UK market by insulation, 2023 - 2027 (USD Million)
  • TABLE 238 UK market by insulation, 2028 - 2032 (USD Million)
  • TABLE 239 UK market by end use, 2019 - 2022 ('000 Units)
  • TABLE 240 UK market by end use, 2023 - 2027 ('000 Units)
  • TABLE 241 UK market by end use, 2028 - 2032 ('000 Units)
  • TABLE 242 UK market by end use, 2019 - 2022 (USD Million)
  • TABLE 243 UK market by end use, 2023 - 2027 (USD Million)
  • TABLE 244 UK market by end use, 2028 - 2032 (USD Million)
  • TABLE 245 UK market by application, 2019 - 2022 ('000 Units)
  • TABLE 246 UK market by application, 2023 - 2027 ('000 Units)
  • TABLE 247 UK market by application, 2028 - 2032 ('000 Units)
  • TABLE 248 UK market by application, 2019 - 2022 (USD Million)
  • TABLE 249 UK market by application, 2023 - 2027 (USD Million)
  • TABLE 250 UK market by application, 2028 - 2032 (USD Million)
  • TABLE 251 Germany market, 2019 - 2022 (Volume & Revenue)
  • TABLE 252 Germany market, 2023 - 2027 (Volume & Revenue)
  • TABLE 253 Germany market, 2028 - 2032 (Volume & Revenue)
  • TABLE 254 Germany market by voltage, 2019 - 2022 ('000 Units)
  • TABLE 255 Germany market by voltage, 2023 - 2027 ('000 Units)
  • TABLE 256 Germany market by voltage, 2028 - 2032 ('000 Units)
  • TABLE 257 Germany market by voltage, 2019 - 2022 (USD Million)
  • TABLE 258 Germany market by voltage, 2023 - 2027 (USD Million)
  • TABLE 259 Germany market by voltage, 2028 - 2032 (USD Million)
  • TABLE 260 Germany market by component, 2019 - 2022 ('000 Units)
  • TABLE 261 Germany market by component, 2023 - 2027 ('000 Units)
  • TABLE 262 Germany market by component, 2028 - 2032 ('000 Units)
  • TABLE 263 Germany market by component, 2019 - 2022 (USD Million)
  • TABLE 264 Germany market by component, 2023 - 2027 (USD Million)
  • TABLE 265 Germany market by component, 2028 - 2032 (USD Million)
  • TABLE 266 Germany market by insulation, 2019 - 2022 ('000 Units)
  • TABLE 267 Germany market by insulation, 2023 - 2027 ('000 Units)
  • TABLE 268 Germany market by insulation, 2028 - 2032 ('000 Units)
  • TABLE 269 Germany market by insulation, 2019 - 2022 (USD Million)
  • TABLE 270 Germany market by insulation, 2023 - 2027 (USD Million)
  • TABLE 271 Germany market by insulation, 2028 - 2032 (USD Million)
  • TABLE 272 Germany market by end use, 2019 - 2022 ('000 Units)
  • TABLE 273 Germany market by end use, 2023 - 2027 ('000 Units)
  • TABLE 274 Germany market by end use, 2028 - 2032 ('000 Units)
  • TABLE 275 Germany market by end use, 2019 - 2022 (USD Million)
  • TABLE 276 Germany market by end use, 2023 - 2027 (USD Million)
  • TABLE 277 Germany market by end use, 2028 - 2032 (USD Million)
  • TABLE 278 Germany market by application, 2019 - 2022 ('000 Units)
  • TABLE 279 Germany market by application, 2023 - 2027 ('000 Units)
  • TABLE 280 Germany market by application, 2028 - 2032 ('000 Units)
  • TABLE 281 Germany market by application, 2019 - 2022 (USD Million)
  • TABLE 282 Germany market by application, 2023 - 2027 (USD Million)
  • TABLE 283 Germany market by application, 2028 - 2032 (USD Million)
  • TABLE 284 France market, 2019 - 2022 (Volume & Revenue)
  • TABLE 285 France market, 2023 - 2027 (Volume & Revenue)
  • TABLE 286 France market, 2028 - 2032 (Volume & Revenue)
  • TABLE 287 France market by voltage, 2019 - 2022 ('000 Units)
  • TABLE 288 France market by voltage, 2023 - 2027 ('000 Units)
  • TABLE 289 France market by voltage, 2028 - 2032 ('000 Units)
  • TABLE 290 France market by voltage, 2019 - 2022 (USD Million)
  • TABLE 291 France market by voltage, 2023 - 2027 (USD Million)
  • TABLE 292 France market by voltage, 2028 - 2032 (USD Million)
  • TABLE 293 France market by component, 2019 - 2022 ('000 Units)
  • TABLE 294 France market by component, 2023 - 2027 ('000 Units)
  • TABLE 295 France market by component, 2028 - 2032 ('000 Units)
  • TABLE 296 France market by component, 2019 - 2022 (USD Million)
  • TABLE 297 France market by component, 2023 - 2027 (USD Million)
  • TABLE 298 France market by component, 2028 - 2032 (USD Million)
  • TABLE 299 France market by insulation, 2019 - 2022 ('000 Units)
  • TABLE 300 France market by insulation, 2023 - 2027 ('000 Units)
  • TABLE 301 France market by insulation, 2028 - 2032 ('000 Units)
  • TABLE 302 France market by insulation, 2019 - 2022 (USD Million)
  • TABLE 303 France market by insulation, 2023 - 2027 (USD Million)
  • TABLE 304 France market by insulation, 2028 - 2032 (USD Million)
  • TABLE 305 France market by end use, 2019 - 2022 ('000 Units)
  • TABLE 306 France market by end use, 2023 - 2027 ('000 Units)
  • TABLE 307 France market by end use, 2028 - 2032 ('000 Units)
  • TABLE 308 France market by end use, 2019 - 2022 (USD Million)
  • TABLE 309 France market by end use, 2023 - 2027 (USD Million)
  • TABLE 310 France market by end use, 2028 - 2032 (USD Million)
  • TABLE 311 France market by application, 2019 - 2022 ('000 Units)
  • TABLE 312 France market by application, 2023 - 2027 ('000 Units)
  • TABLE 313 France market by application, 2028 - 2032 ('000 Units)
  • TABLE 314 France market by application, 2019 - 2022 (USD Million)
  • TABLE 315 France market by application, 2023 - 2027 (USD Million)
  • TABLE 316 France market by application, 2028 - 2032 (USD Million)
  • TABLE 317 Russia market, 2019 - 2022 (Volume & Revenue)
  • TABLE 318 Russia market, 2023 - 2027 (Volume & Revenue)
  • TABLE 319 Russia market, 2028 - 2032 (Volume & Revenue)
  • TABLE 320 Russia market by voltage, 2019 - 2022 ('000 Units)
  • TABLE 321 Russia market by voltage, 2023 - 2027 ('000 Units)
  • TABLE 322 Russia market by voltage, 2028 - 2032 ('000 Units)
  • TABLE 323 Russia market by voltage, 2019 - 2022 (USD Million)
  • TABLE 324 Russia market by voltage, 2023 - 2027 (USD Million)
  • TABLE 325 Russia market by voltage, 2028 - 2032 (USD Million)
  • TABLE 326 Russia market by component, 2019 - 2022 ('000 Units)
  • TABLE 327 Russia market by component, 2023 - 2027 ('000 Units)
  • TABLE 328 Russia market by component, 2028 - 2032 ('000 Units)
  • TABLE 329 Russia market by component, 2019 - 2022 (USD Million)
  • TABLE 330 Russia market by component, 2023 - 2027 (USD Million)
  • TABLE 331 Russia market by component, 2028 - 2032 (USD Million)
  • TABLE 332 Russia market by insulation, 2019 - 2022 ('000 Units)
  • TABLE 333 Russia market by insulation, 2023 - 2027 ('000 Units)
  • TABLE 334 Russia market by insulation, 2028 - 2032 ('000 Units)
  • TABLE 335 Russia market by insulation, 2019 - 2022 (USD Million)
  • TABLE 336 Russia market by insulation, 2023 - 2027 (USD Million)
  • TABLE 337 Russia market by insulation, 2028 - 2032 (USD Million)
  • TABLE 338 Russia market by end use, 2019 - 2022 ('000 Units)
  • TABLE 339 Russia market by end use, 2023 - 2027 ('000 Units)
  • TABLE 340 Russia market by end use, 2028 - 2032 ('000 Units)
  • TABLE 341 Russia market by end use, 2019 - 2022 (USD Million)
  • TABLE 342 Russia market by end use, 2023 - 2027 (USD Million)
  • TABLE 343 Russia market by end use, 2028 - 2032 (USD Million)
  • TABLE 344 Russia market by application, 2019 - 2022 ('000 Units)
  • TABLE 345 Russia market by application, 2023 - 2027 ('000 Units)
  • TABLE 346 Russia market by application, 2028 - 2032 ('000 Units)
  • TABLE 347 Russia market by application, 2019 - 2022 (USD Million)
  • TABLE 348 Russia market by application, 2023 - 2027 (USD Million)
  • TABLE 349 Russia market by application, 2028 - 2032 (USD Million)
  • TABLE 350 Italy market, 2019 - 2022 (Volume & Revenue)
  • TABLE 351 Italy market, 2023 - 2027 (Volume & Revenue)
  • TABLE 352 Italy market, 2028 - 2032 (Volume & Revenue)
  • TABLE 353 Italy market by voltage, 2019 - 2022 ('000 Units)
  • TABLE 354 Italy market by voltage, 2023 - 2027 ('000 Units)
  • TABLE 355 Italy market by voltage, 2028 - 2032 ('000 Units)
  • TABLE 356 Italy market by voltage, 2019 - 2022 (USD Million)
  • TABLE 357 Italy market by voltage, 2023 - 2027 (USD Million)
  • TABLE 358 Italy market by voltage, 2028 - 2032 (USD Million)
  • TABLE 359 Italy market by component, 2019 - 2022 ('000 Units)
  • TABLE 360 Italy market by component, 2023 - 2027 ('000 Units)
  • TABLE 361 Italy market by component, 2028 - 2032 ('000 Units)
  • TABLE 362 Italy market by component, 2019 - 2022 (USD Million)
  • TABLE 363 Italy market by component, 2023 - 2027 (USD Million)
  • TABLE 364 Italy market by component, 2028 - 2032 (USD Million)
  • TABLE 365 Italy market by insulation, 2019 - 2022 ('000 Units)
  • TABLE 366 Italy market by insulation, 2023 - 2027 ('000 Units)
  • TABLE 367 Italy market by insulation, 2028 - 2032 ('000 Units)
  • TABLE 368 Italy market by insulation, 2019 - 2022 (USD Million)
  • TABLE 369 Italy market by insulation, 2023 - 2027 (USD Million)
  • TABLE 370 Italy market by insulation, 2028 - 2032 (USD Million)
  • TABLE 371 Italy market by end use, 2019 - 2022 ('000 Units)
  • TABLE 372 Italy market by end use, 2023 - 2027 ('000 Units)
  • TABLE 373 Italy market by end use, 2028 - 2032 ('000 Units)
  • TABLE 374 Italy market by end use, 2019 - 2022 (USD Million)
  • TABLE 375 Italy market by end use, 2023 - 2027 (USD Million)
  • TABLE 376 Italy market by end use, 2028 - 2032 (USD Million)
  • TABLE 377 Italy market by application, 2019 - 2022 ('000 Units)
  • TABLE 378 Italy market by application, 2023 - 2027 ('000 Units)
  • TABLE 379 Italy market by application, 2028 - 2032 ('000 Units)
  • TABLE 380 Italy market by application, 2019 - 2022 (USD Million)
  • TABLE 381 Italy market by application, 2023 - 2027 (USD Million)
  • TABLE 382 Italy market by application, 2028 - 2032 (USD Million)
  • TABLE 383 Spain market, 2019 - 2022 (Volume & Revenue)
  • TABLE 384 Spain market, 2023 - 2027 (Volume & Revenue)
  • TABLE 385 Spain market, 2028 - 2032 (Volume & Revenue)
  • TABLE 386 Spain market by voltage, 2019 - 2022 ('000 Units)
  • TABLE 387 Spain market by voltage, 2023 - 2027 ('000 Units)
  • TABLE 388 Spain market by voltage, 2028 - 2032 ('000 Units)
  • TABLE 389 Spain market by voltage, 2019 - 2022 (USD Million)
  • TABLE 390 Spain market by voltage, 2023 - 2027 (USD Million)
  • TABLE 391 Spain market by voltage, 2028 - 2032 (USD Million)
  • TABLE 392 Spain market by component, 2019 - 2022 ('000 Units)
  • TABLE 393 Spain market by component, 2023 - 2027 ('000 Units)
  • TABLE 394 Spain market by component, 2028 - 2032 ('000 Units)
  • TABLE 395 Spain market by component, 2019 - 2022 (USD Million)
  • TABLE 396 Spain market by component, 2023 - 2027 (USD Million)
  • TABLE 397 Spain market by component, 2028 - 2032 (USD Million)
  • TABLE 398 Spain market by insulation, 2019 - 2022 ('000 Units)
  • TABLE 399 Spain market by insulation, 2023 - 2027 ('000 Units)
  • TABLE 400 Spain market by insulation, 2028 - 2032 ('000 Units)
  • TABLE 401 Spain market by insulation, 2019 - 2022 (USD Million)
  • TABLE 402 Spain market by insulation, 2023 - 2027 (USD Million)
  • TABLE 403 Spain market by insulation, 2028 - 2032 (USD Million)
  • TABLE 404 Spain market by end use, 2019 - 2022 ('000 Units)
  • TABLE 405 Spain market by end use, 2023 - 2027 ('000 Units)
  • TABLE 406 Spain market by end use, 2028 - 2032 ('000 Units)
  • TABLE 407 Spain market by end use, 2019 - 2022 (USD Million)
  • TABLE 408 Spain market by end use, 2023 - 2027 (USD Million)
  • TABLE 409 Spain market by end use, 2028 - 2032 (USD Million)
  • TABLE 410 Spain market by application, 2019 - 2022 ('000 Units)
  • TABLE 411 Spain market by application, 2023 - 2027 ('000 Units)
  • TABLE 412 Spain market by application, 2028 - 2032 ('000 Units)
  • TABLE 413 Spain market by application, 2019 - 2022 (USD Million)
  • TABLE 414 Spain market by application, 2023 - 2027 (USD Million)
  • TABLE 415 Spain market by application, 2028 - 2032 (USD Million)

Charts & Figures

  • FIG. 1 GMI report coverage: critical research elements
  • FIG. 2 Industry segmentation
  • FIG. 3 Market forecasting methodology
  • FIG. 4 Profile break-up of primary respondents
  • FIG. 5 Industry ecosystem analysis
  • FIG. 6 Growth potential analysis
  • FIG. 7 Porter's Analysis
  • FIG. 8 PESTEL Analysis
  • FIG. 9 SWOT Analysis, ABB
  • FIG. 10 SWOT Analysis, Siemens
  • FIG. 11 SWOT Analysis, General Electric
  • FIG. 12 SWOT Analysis, Mitsubishi Electric Corporation
  • FIG. 13 SWOT Analysis, Schneider Electric
  • FIG. 14 SWOT Analysis, Ormazabal
  • FIG. 15 SWOT Analysis, Bharat Heavy Electricals Limited
  • FIG. 16 SWOT Analysis, CG Power & Industrial Solutions Ltd.
  • FIG. 17 SWOT Analysis, CHINT Group
  • FIG. 18 SWOT Analysis, Eaton
  • FIG. 19 SWOT Analysis, HYOSUNG HEAVY INDUSTRIES
  • FIG. 20 SWOT Analysis, Lucy Group Ltd.
  • FIG. 21 SWOT Analysis, HD Hyundai Electric Co., Ltd.
  • FIG. 22 SWOT Analysis, Powell Industries
  • FIG. 23 SWOT Analysis, Toshiba Infrastructure Systems & Solutions Corporation
Have a question?
Picture

Jeroen Van Heghe

Manager - EMEA

+32-2-535-7543

Picture

Christine Sirois

Manager - Americas

+1-860-674-8796

Questions? Please give us a call or visit the contact form.
Hi, how can we help?
Contact us!