
PUBLISHER: Global Market Insights Inc. | PRODUCT CODE: 1928941

PUBLISHER: Global Market Insights Inc. | PRODUCT CODE: 1928941
Poultry Probiotic Ingredients Market Opportunity, Growth Drivers, Industry Trend Analysis, and Forecast 2026 - 2035
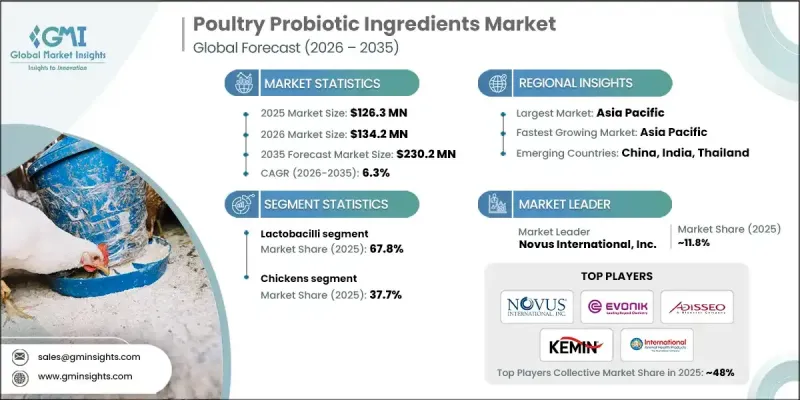
The Global Poultry Probiotic Ingredients Market was valued at USD 126.3 million in 2025 and is estimated to grow at a CAGR of 6.3% to reach USD 230.2 million by 2035.
Poultry probiotic ingredients consist of carefully formulated beneficial microorganisms that support gut health, enhance feed conversion efficiency, strengthen immunity, and improve overall bird performance in commercial operations. These ingredients include strains such as Bacillus, Streptococcus, Bifidobacterium, Lactobacilli, and other probiotic microbes that play critical roles in pathogen suppression, nutrient absorption, digestive optimization, and disease resistance, and serve as natural alternatives to antibiotics. Increasing global poultry production, the rise of antibiotic-free farming practices, and advancements in probiotic technologies are driving growth in this market. Continuous investment in multi-strain formulations, advanced strain development, and performance optimization across different poultry species ensures robust global demand, providing producers with improved gut colonization, stronger pathogen inhibition, enhanced feed conversion ratios, and optimized immune responses across commercial poultry systems.
| Market Scope | |
|---|---|
| Start Year | 2025 |
| Forecast Year | 2026-2035 |
| Start Value | $126.3 Million |
| Forecast Value | $230.2 Million |
| CAGR | 6.3% |
The lactobacilli segment held a 67.8% share and is expected to grow at a CAGR of 6.2% through 2035. Its dominance stems from superior gut colonization, effective pathogen inhibition, and proven performance across broilers, layers, and breeding stock. Lactobacilli support intestinal health through lactic acid production and provide competitive exclusion against harmful bacteria, making them the preferred probiotic strain for commercial poultry operations.
The chickens segment held a 37.7% share and is anticipated to grow at a CAGR of 6.6% through 2035. This is driven by chickens' overwhelming presence in global poultry production, covering both meat and egg production. The segment benefits from established probiotic protocols, validated research across production stages, and measurable ROI through improved feed conversion, reduced mortality, and increased overall productivity.
U.S. Poultry Probiotic Ingredients Market accounted for USD 31.2 million in 2025. Growth in North America is fueled by strong demand from commercial broiler operations for gut health optimization, multi-strain probiotics for antibiotic-free farming, and integrated layer operations employing advanced probiotic programs to improve production efficiency.
Key players operating in the Global Poultry Probiotic Ingredients Market include Novus International, Novonesis (formerly Chr. Hansen), Biomin Holding GmbH, Evonik Industries AG, Adisseo France SAS, Kemin Industries, Huvepharma AD, International Animal Health Products, Pic-Bio, Inc., Neospark, Lallemand Animal Nutrition, Alltech, and Arm & Hammer Animal Nutrition. Companies in the Poultry Probiotic Ingredients Market strengthen their foothold by investing in research and development for novel strains, multi-strain formulations, and advanced delivery systems. Expanding production capacities, establishing strategic partnerships with feed producers, and entering emerging geographic markets help enhance reach and distribution. Firms also emphasize quality assurance, regulatory compliance, and scientifically validated performance data to build customer trust.
Table of Contents
Chapter 1 Methodology & Scope
- 1.1 Market scope and definition
- 1.2 Research design
- 1.2.1 Research approach
- 1.2.2 Data collection methods
- 1.3 Data mining sources
- 1.3.1 Global
- 1.3.2 Regional/Country
- 1.4 Base estimates and calculations
- 1.4.1 Base year calculation
- 1.4.2 Key trends for market estimation
- 1.5 Primary research and validation
- 1.5.1 Primary sources
- 1.6 Forecast model
- 1.7 Research assumptions and limitations
Chapter 2 Executive Summary
- 2.1 Industry 360° synopsis
- 2.2 Key market trends
- 2.2.1 Product
- 2.2.2 Application
- 2.2.3 Regional
- 2.3 TAM Analysis, 2025-2035
- 2.4 CXO perspectives: Strategic imperatives
- 2.4.1 Executive decision points
- 2.4.2 Critical success factors
- 2.5 Future outlook and strategic recommendations
Chapter 3 Industry Insights
- 3.1 Industry ecosystem analysis
- 3.1.1 Supplier landscape
- 3.1.2 Profit margin
- 3.1.3 Value addition at each stage
- 3.1.4 Factor affecting the value chain
- 3.1.5 Disruptions
- 3.2 Industry impact forces
- 3.2.1 Growth drivers
- 3.2.2 Industry pitfalls and challenges
- 3.2.3 Market opportunities
- 3.3 Growth potential analysis
- 3.4 Regulatory landscape
- 3.4.1 North America
- 3.4.2 Europe
- 3.4.3 Asia Pacific
- 3.4.4 Latin America
- 3.4.5 Middle East & Africa
- 3.5 Porter';s analysis
- 3.6 PESTEL analysis
- 3.7 Technology and innovation landscape
- 3.7.1 Current technological trends
- 3.7.2 Emerging technologies
- 3.8 Price trends
- 3.8.1 By region
- 3.8.2 By product grade
- 3.9 Future market trends
- 3.10 Technology and innovation landscape
- 3.10.1 Current technological trends
- 3.10.2 Emerging technologies
- 3.11 Patent landscape
- 3.12 Trade statistics (HS code) (Note: the trade statistics will be provided for key countries only)
- 3.12.1 Major importing countries
- 3.12.2 Major exporting countries
- 3.13 Sustainability and environmental aspects
- 3.13.1 Sustainable practices
- 3.13.2 Waste reduction strategies
- 3.13.3 Energy efficiency in production
- 3.13.4 Eco-friendly initiatives
- 3.14 Carbon footprint consideration
Chapter 4 Competitive Landscape, 2025
- 4.1 Introduction
- 4.2 Company market share analysis
- 4.2.1 By region
- 4.2.1.1 North America
- 4.2.1.2 Europe
- 4.2.1.3 Asia Pacific
- 4.2.1.4 LATAM
- 4.2.1.5 MEA
- 4.2.1 By region
- 4.3 Company matrix analysis
- 4.4 Competitive analysis of major market players
- 4.5 Competitive positioning matrix
- 4.6 Key developments
- 4.6.1 Mergers & acquisitions
- 4.6.2 Partnerships & collaborations
- 4.6.3 New product launches
- 4.6.4 Expansion plans
Chapter 5 Market Estimates and Forecast, By Product, 2022-2035 (USD Million) (Kilo Tons)
- 5.1 Key trends
- 5.2 Lactobacilli
- 5.2.1 L. acidophilus
- 5.2.2 L. plantarum
- 5.2.3 L. reuteri
- 5.2.4 L. salivarius
- 5.2.5 Others
- 5.3 Bifidobacterium
- 5.4 B. bifidum
- 5.4.1 B. longum
- 5.4.2 B. animalis
- 5.4.3 Others
- 5.5 Streptococcus
- 5.5.1 S. thermophilus
- 5.5.2 Enterococcus faecium
- 5.6 Bacillus
- 5.6.1 B. subtilis
- 5.6.2 B. licheniformis
- 5.6.3 B. amyloliquefaciens
- 5.6.4 Others
- 5.7 Others
Chapter 6 Market Estimates and Forecast, By Application, 2022-2035 (USD Million) (Kilo Tons)
- 6.1 Key trends
- 6.2 Chickens
- 6.2.1 Broilers
- 6.2.2 Layers
- 6.2.3 Breeders
- 6.3 Turkeys
- 6.4 Ducks
- 6.5 Geese
- 6.6 Others
Chapter 7 Market Estimates and Forecast, By Region, 2022-2035 (USD Million) (Kilo Tons)
- 7.1 Key trends
- 7.2 North America
- 7.2.1 U.S.
- 7.2.2 Canada
- 7.3 Europe
- 7.3.1 Germany
- 7.3.2 UK
- 7.3.3 France
- 7.3.4 Spain
- 7.3.5 Italy
- 7.3.6 Rest of Europe
- 7.4 Asia Pacific
- 7.4.1 China
- 7.4.2 India
- 7.4.3 Japan
- 7.4.4 Australia
- 7.4.5 South Korea
- 7.4.6 Rest of Asia Pacific
- 7.5 Latin America
- 7.5.1 Brazil
- 7.5.2 Mexico
- 7.5.3 Argentina
- 7.5.4 Rest of Latin America
- 7.6 Middle East and Africa
- 7.6.1 Saudi Arabia
- 7.6.2 South Africa
- 7.6.3 UAE
- 7.6.4 Rest of Middle East and Africa
Chapter 8 Company Profiles
- 8.1 Novonesis (formerly Chr. Hansen)
- 8.2 Novus International
- 8.3 Biomin Holding GmbH
- 8.4 Evonik Industries AG
- 8.5 Adisseo France SAS
- 8.6 Huvepharma AD
- 8.7 Kemin Industries
- 8.8 International Animal Health Products
- 8.9 Pic-Bio, Inc.
- 8.10 Neospark
- 8.11 Lallemand Animal Nutrition
- 8.12 Alltech
- 8.13 Arm & Hammer Animal Nutrition

